
Chart patterns: how to recognise and trade them

Bobby

Written by Bobby

Overview of the main chart patterns

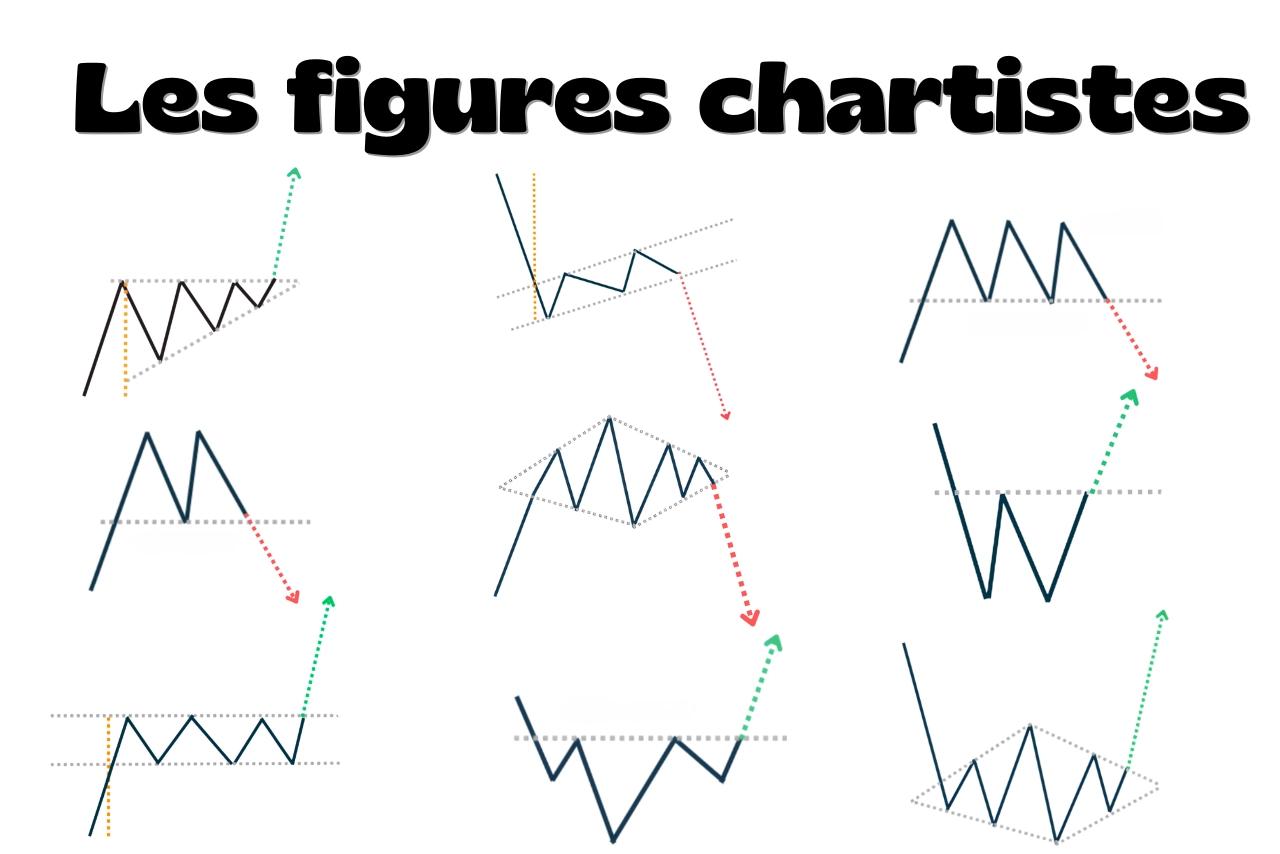
Chart patterns are shapes that price forms on a chart.

Each pattern reflects a market condition : hesitant buyers, sellers losing momentum, a trend resuming or reversing, and so on.

When the same shape appears in similar conditions, traders use it to anticipate where price might go next, because buyers and sellers tend to repeat the same behaviours.

Why do chart patterns work?

Many traders watch the same patterns and react to the same signals. Their combined orders can help produce the move they were expecting.

That’s the basic idea behind chart analysis : reading market psychology through price movements.

The main types of chart patterns

There are two main categories:

How to confirm a chart pattern

A chart pattern isn’t confirmed just because it looks like a familiar shape.

It’s confirmed when price breaks a specific level, as shown in the table below.

That said, even a well-formed pattern can fail or give a false signal.
Key chart patterns at a glance

Key chart patterns and their confirmation signals.
Confirmation
Ascending broadening wedgeBiseau d'élargissement ascendant
Reversal
Break below support
Ascending channelCanal haussier
Continuation
Break above resistance
Ascending triangleTriangle ascendant
Continuation
Break above resistance
Bearish flagDrapeau baissier
Continuation
Break below support
Bearish pennantFanion baissier
Continuation
Break below support
Bearish rectangleRectangle baissier
Continuation
Break below support
Bearish symmetrical triangleTriangle symétrique de creux
Continuation
Break below support
Bullish flagDrapeau haussier
Continuation
Break above resistance
Bullish pennantFanion haussier
Continuation
Break above resistance
Bullish rectangleRectangle haussier
Continuation
Break above resistance
Bullish symmetrical triangleTriangle symétrique de sommet
Continuation
Break above resistance
Bump and RunBump and Run
Reversal
Break above resistance
Bump and Run ReversalBump and Run Reversal
Reversal
Break below support
Cup and handleTasse avec anse
Continuation
Break above the upper boundary
Descending broadening wedgeBiseau d'élargissement descendant
Reversal
Break above resistance
Descending channelCanal baissier
Continuation
Break below support
Descending triangleTriangle descendant
Continuation
Break below support
Diamond bottomDiamant de creux
Reversal
Break above the upper boundary
Diamond topDiamant de sommet
Reversal
Break below the lower boundary
Double bottomDouble creux
Reversal
Neckline break
Double topDouble sommet
Reversal
Neckline break
Falling wedgeBiseau descendant
Reversal
Break above resistance
Head and shouldersÉpaule-tête-épaule
Reversal
Neckline break
Inverse head and shouldersÉpaule-tête-épaule inversée
Reversal
Neckline break
Inverted cup and handleTasse avec anse inversée
Continuation
Break below the lower boundary
Liquidity sweepBalayage de liquidité
Other pattern
Return through the level
Rising wedgeBiseau ascendant
Reversal
Break below support
Rounding bottomArrondi de creux
Reversal
Neckline break
Rounding topArrondi de sommet
Reversal
Neckline break
Triple bottomTriple creux
Reversal
Neckline break
Triple topTriple sommet
Reversal
Neckline break
V bottomCreux en V
Reversal
Neckline break
V topSommet en V
Reversal
Neckline break

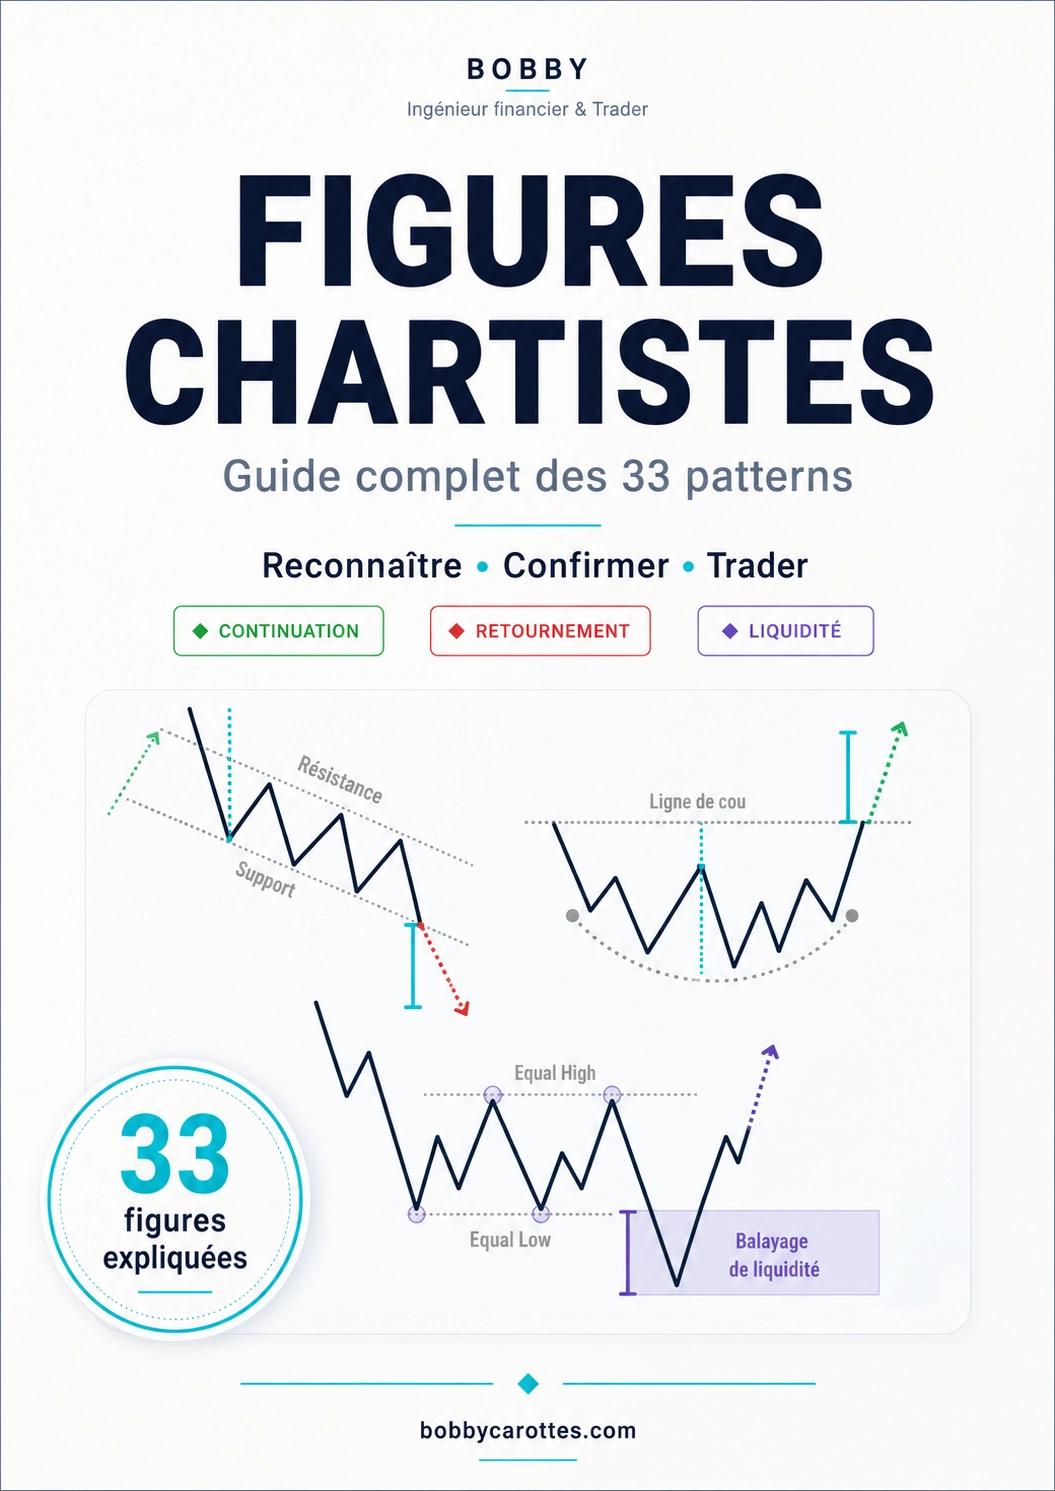
Download the chart patterns PDF

Chart patterns PDF with 33 trading patterns

Download the chart patterns PDF to keep all 33 patterns handy while you analyse a chart.

FAQ

What are the best-known chart patterns?

The best-known chart patterns include the double top, triple top, double bottom, triple bottom, head and shoulders, and diamond.

What’s the difference between spotting a pattern and trading it?

Spotting a pattern means recognising its shape. Trading it means having an entry level, an invalidation level and a target.

Which timeframe should you use to identify chart patterns?

There’s no perfect timeframe. What matters most is choosing a chart that lets you clearly see the structure and its confirmation level.

Can you rely on a chart pattern alone?

No. A pattern alone isn’t enough. At the very least, you need to wait for confirmation and read it in context.

Do chart patterns form in real time, or only become clear afterwards?

Both. That’s why we always wait for confirmation before entering.

Bobby

Written by

Bobby

Independent trader

I'm a former financial engineer and spent seven years on trading floors and at a hedge fund. For over three years, I've been sharing my trading experience and what I know about finance.