
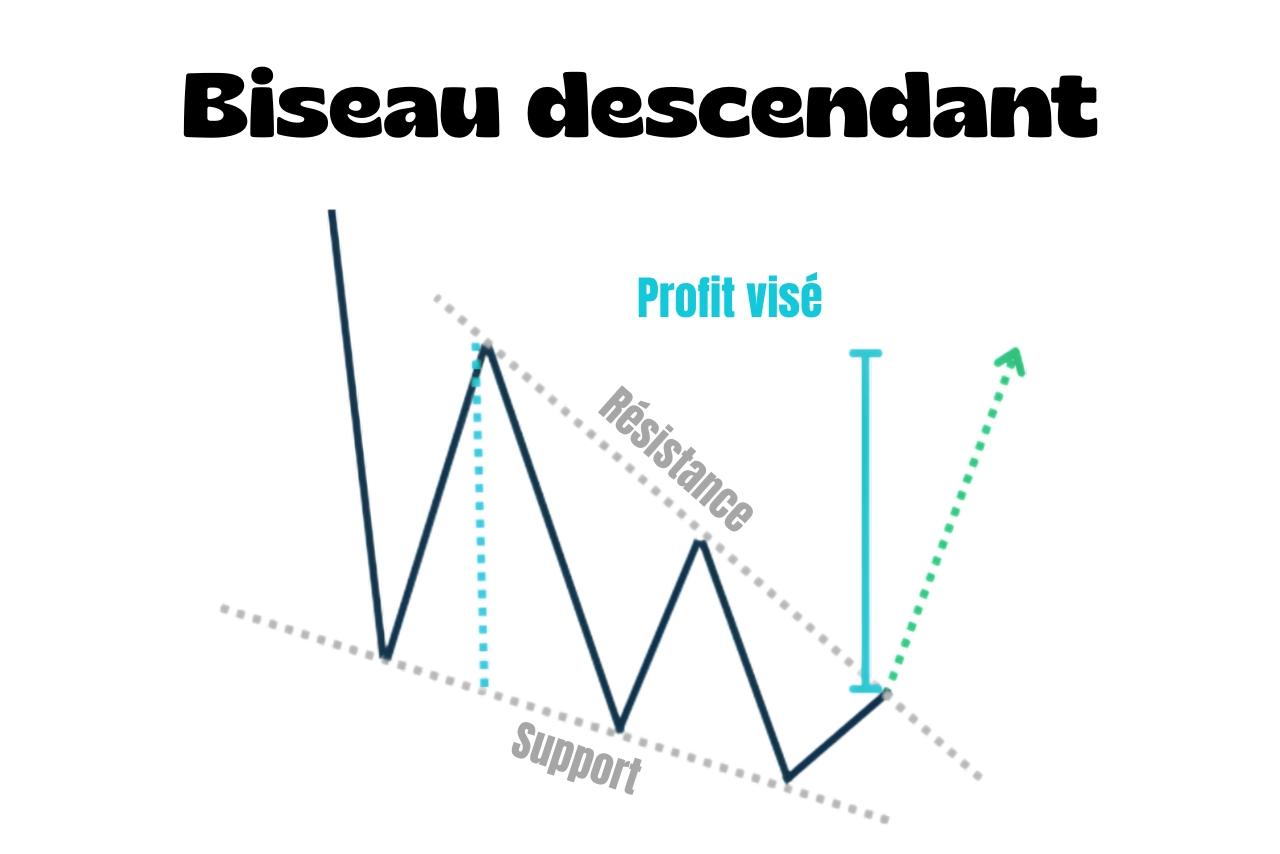
A falling wedge is a bullish reversal chart pattern.
✅
It forms between two converging, downward-sloping trendlines, with resistance falling faster than support.
Like its opposite, the rising wedge, it can appear on any timeframe.
How do you recognise it?
- The market was already falling before the pattern appeared
- Price moves between two converging downward-sloping lines: resistance has the steeper slope, support the gentler one
- Each new downward move is weaker than the last
- Price breaks upwards through resistance
How do you trade it?
The simplest way to trade a falling wedge without jumping in too early is to follow these steps:
- Identify a preceding decline
- Check that the two lines are converging
- Watch for bullish divergence using a technical indicator such as RSI
- Wait for the breakout
- Project the pattern's height to set the take-profit
- Place the stop-loss below the most recent low
