
What is the RSI?
The RSI, or Relative Strength Index, measures the speed and magnitude of an asset's price movements.
How do you read the RSI?
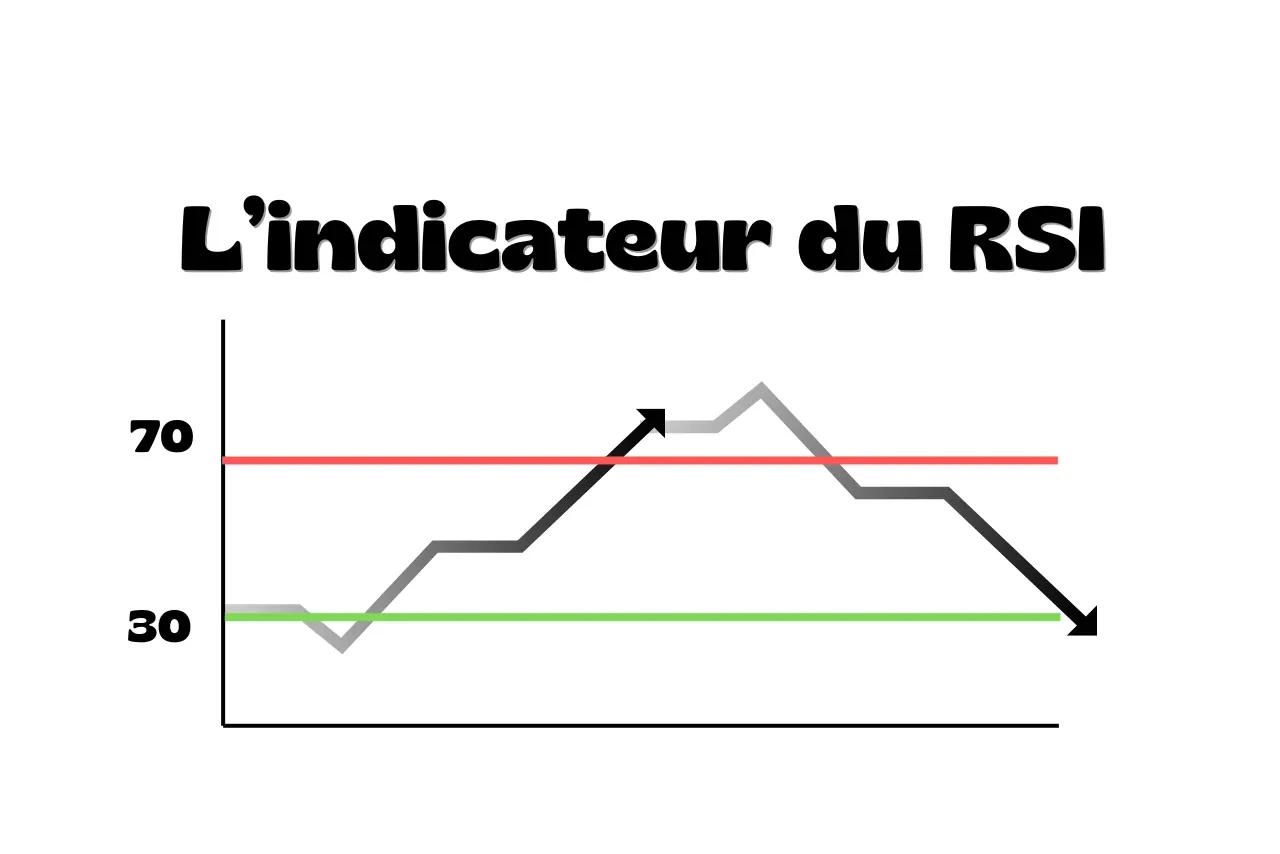
The RSI appears as a line ranging from 0 to 100 on a chart.
- Above 70, the asset is considered overbought
- Below 30, it's considered oversold
- Between 30 and 70 is the neutral zone
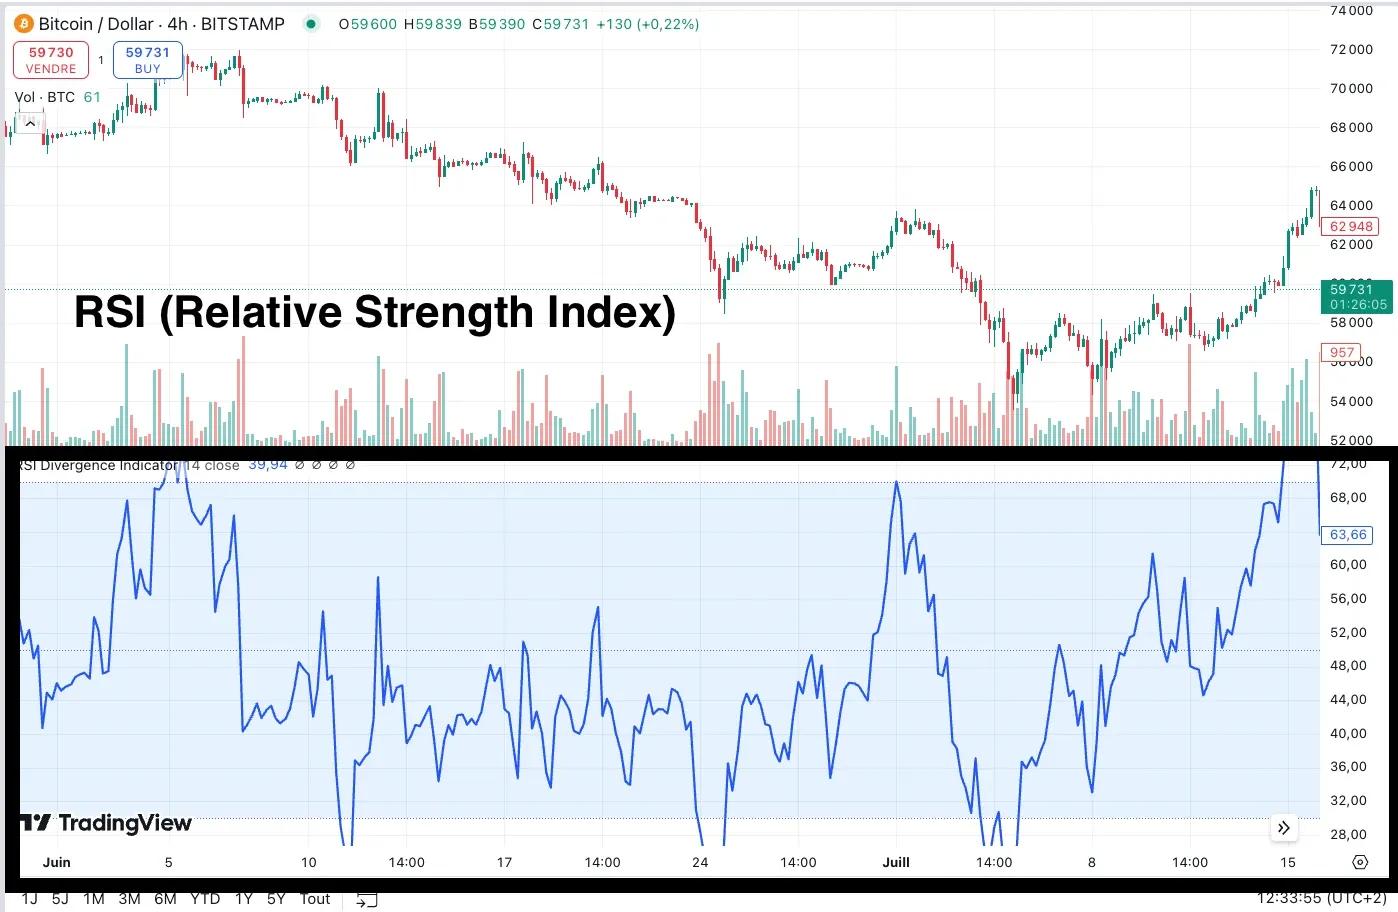
Take Bitcoin, as shown in the chart above:
On 6 July 2024, the price is around $54,000 and the RSI is close to 30.
That means Bitcoin has fallen a lot recently and may be undervalued.
It might be a time to buy.
A few days later, around 15 July, Bitcoin has risen to about $59,700 and the RSI is close to 70.
That suggests Bitcoin may have risen too far and it might be time to consider selling.
This isn't a 100% guarantee. Price can keep rising even when the RSI is above 70.
Bitcoin could easily continue to $62,000 or higher before falling, as the right-hand side of the chart shows.
How can you use the RSI in your trading?
1. Identify overbought and oversold areas
- When the RSI moves above 70, you can consider selling because the asset may be overbought
- When it moves below 30, you can consider buying because the asset may be oversold
Here's a concrete example using the gold market shown on the chart:
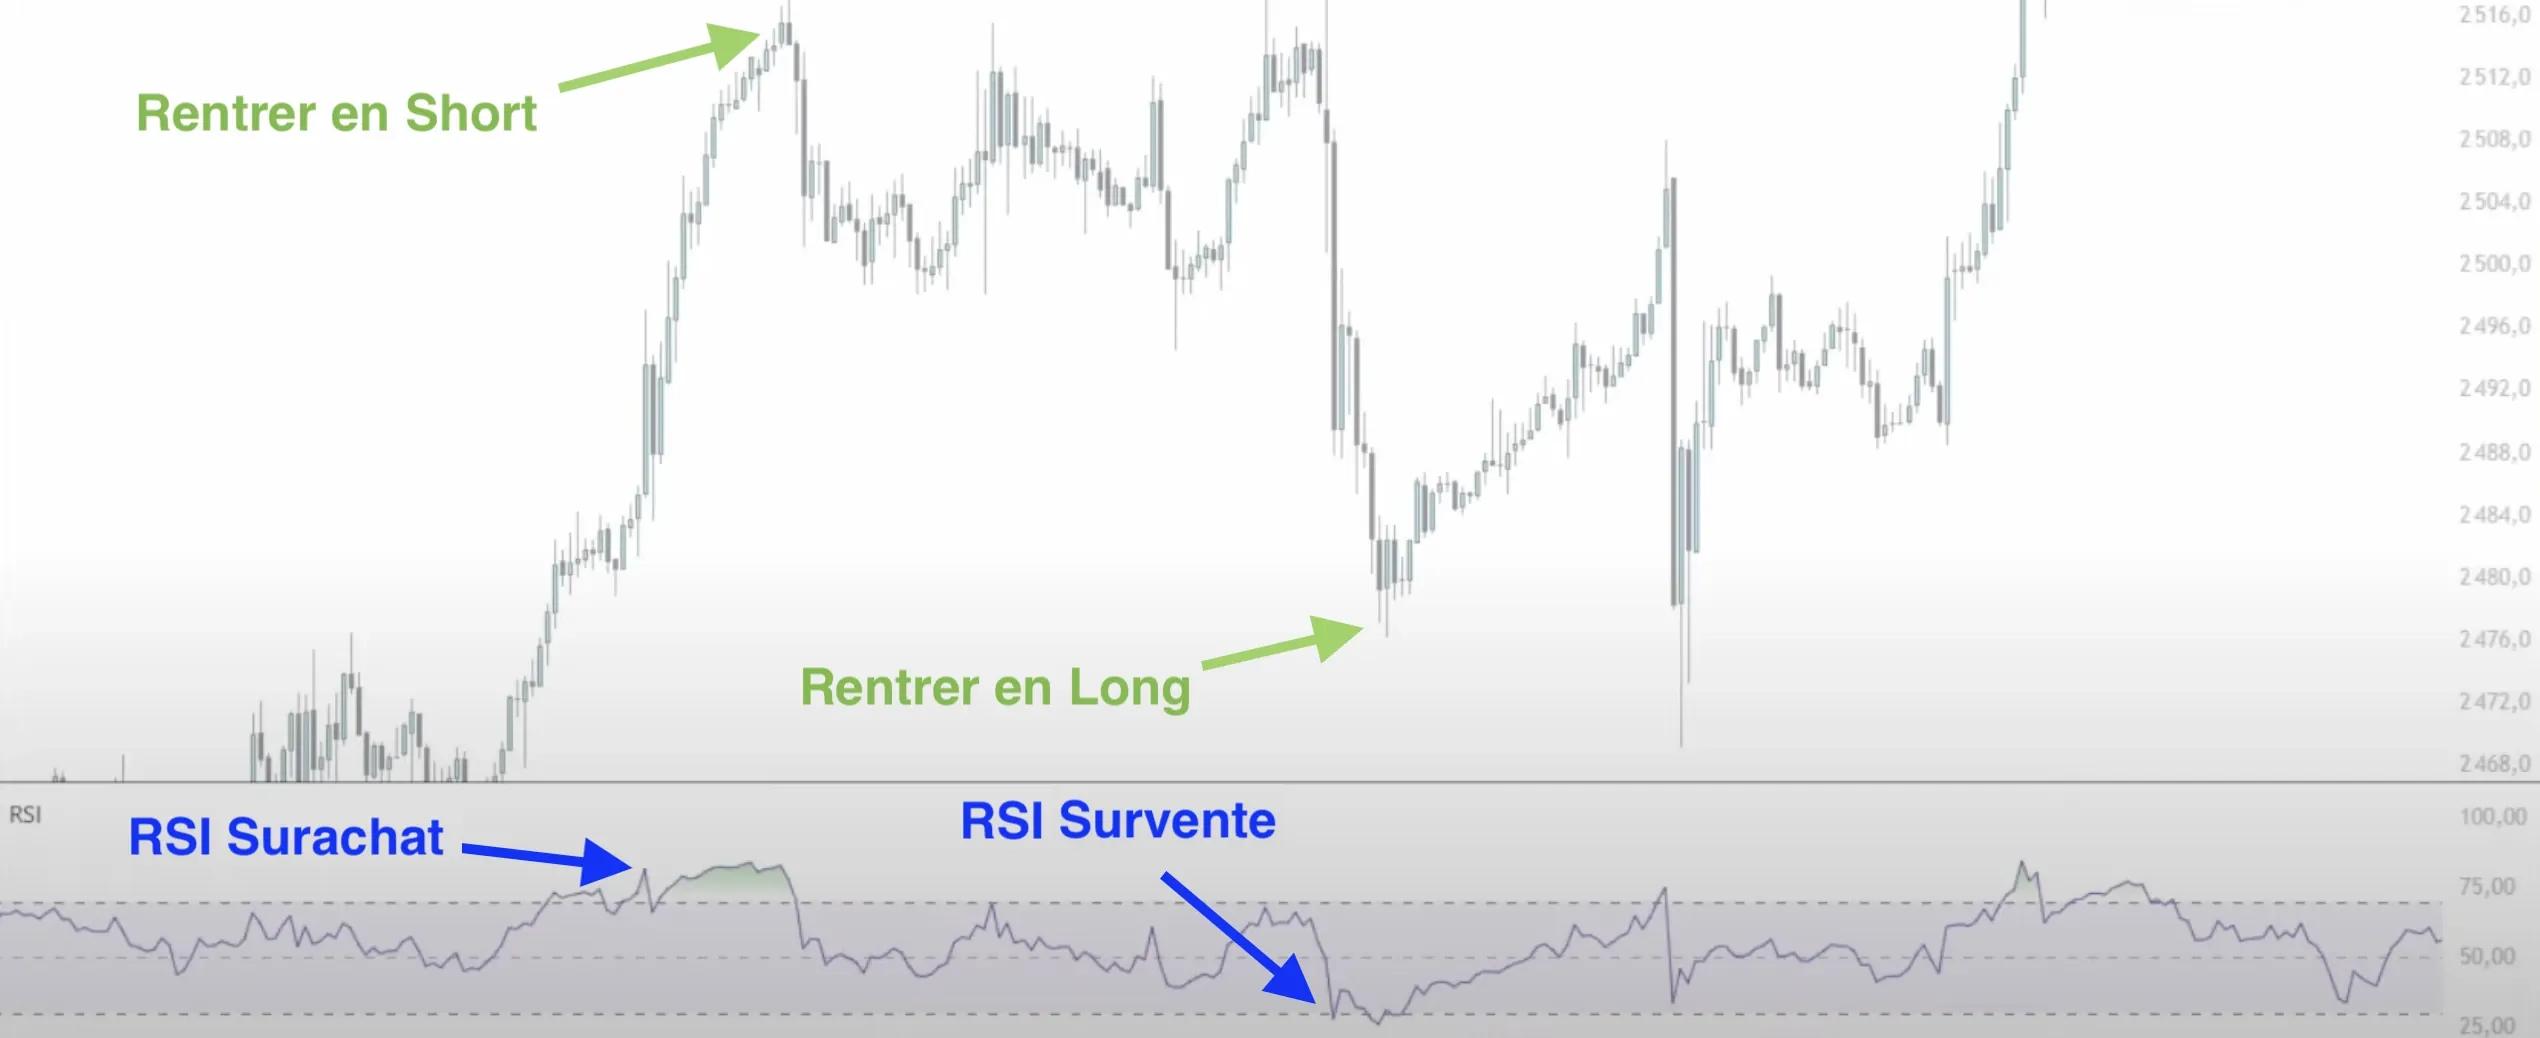
You notice that the RSI has risen above 70, into overbought territory.
That's a warning sign, but not necessarily an immediate sell signal.
You decide to wait for the RSI to drop below 70 before considering a sale.
When that happens, you also look at other factors. Many traders use chart analysis alongside the RSI:
- Has gold formed a bearish chart pattern?
- Did volume increase during the decline?
- Are any major economic events coming up that could affect gold's price?
Don't use the RSI alone. Always combine it with other indicators and analysis.
If everything lines up, you may decide to short gold, as shown by the short-entry arrow on the chart.
Conversely, when the RSI enters oversold territory below 30, you can consider buying.
The chart shows a buying opportunity just after a period when the RSI was oversold.
2. Spot divergences
Divergences are warning signs. They tell you price and the RSI aren't moving in the same direction.
If price rises but the RSI falls, that's a divergence that may signal a reversal.
Imagine gold makes a new high around $2,560, but the RSI makes a lower high than its previous peak:
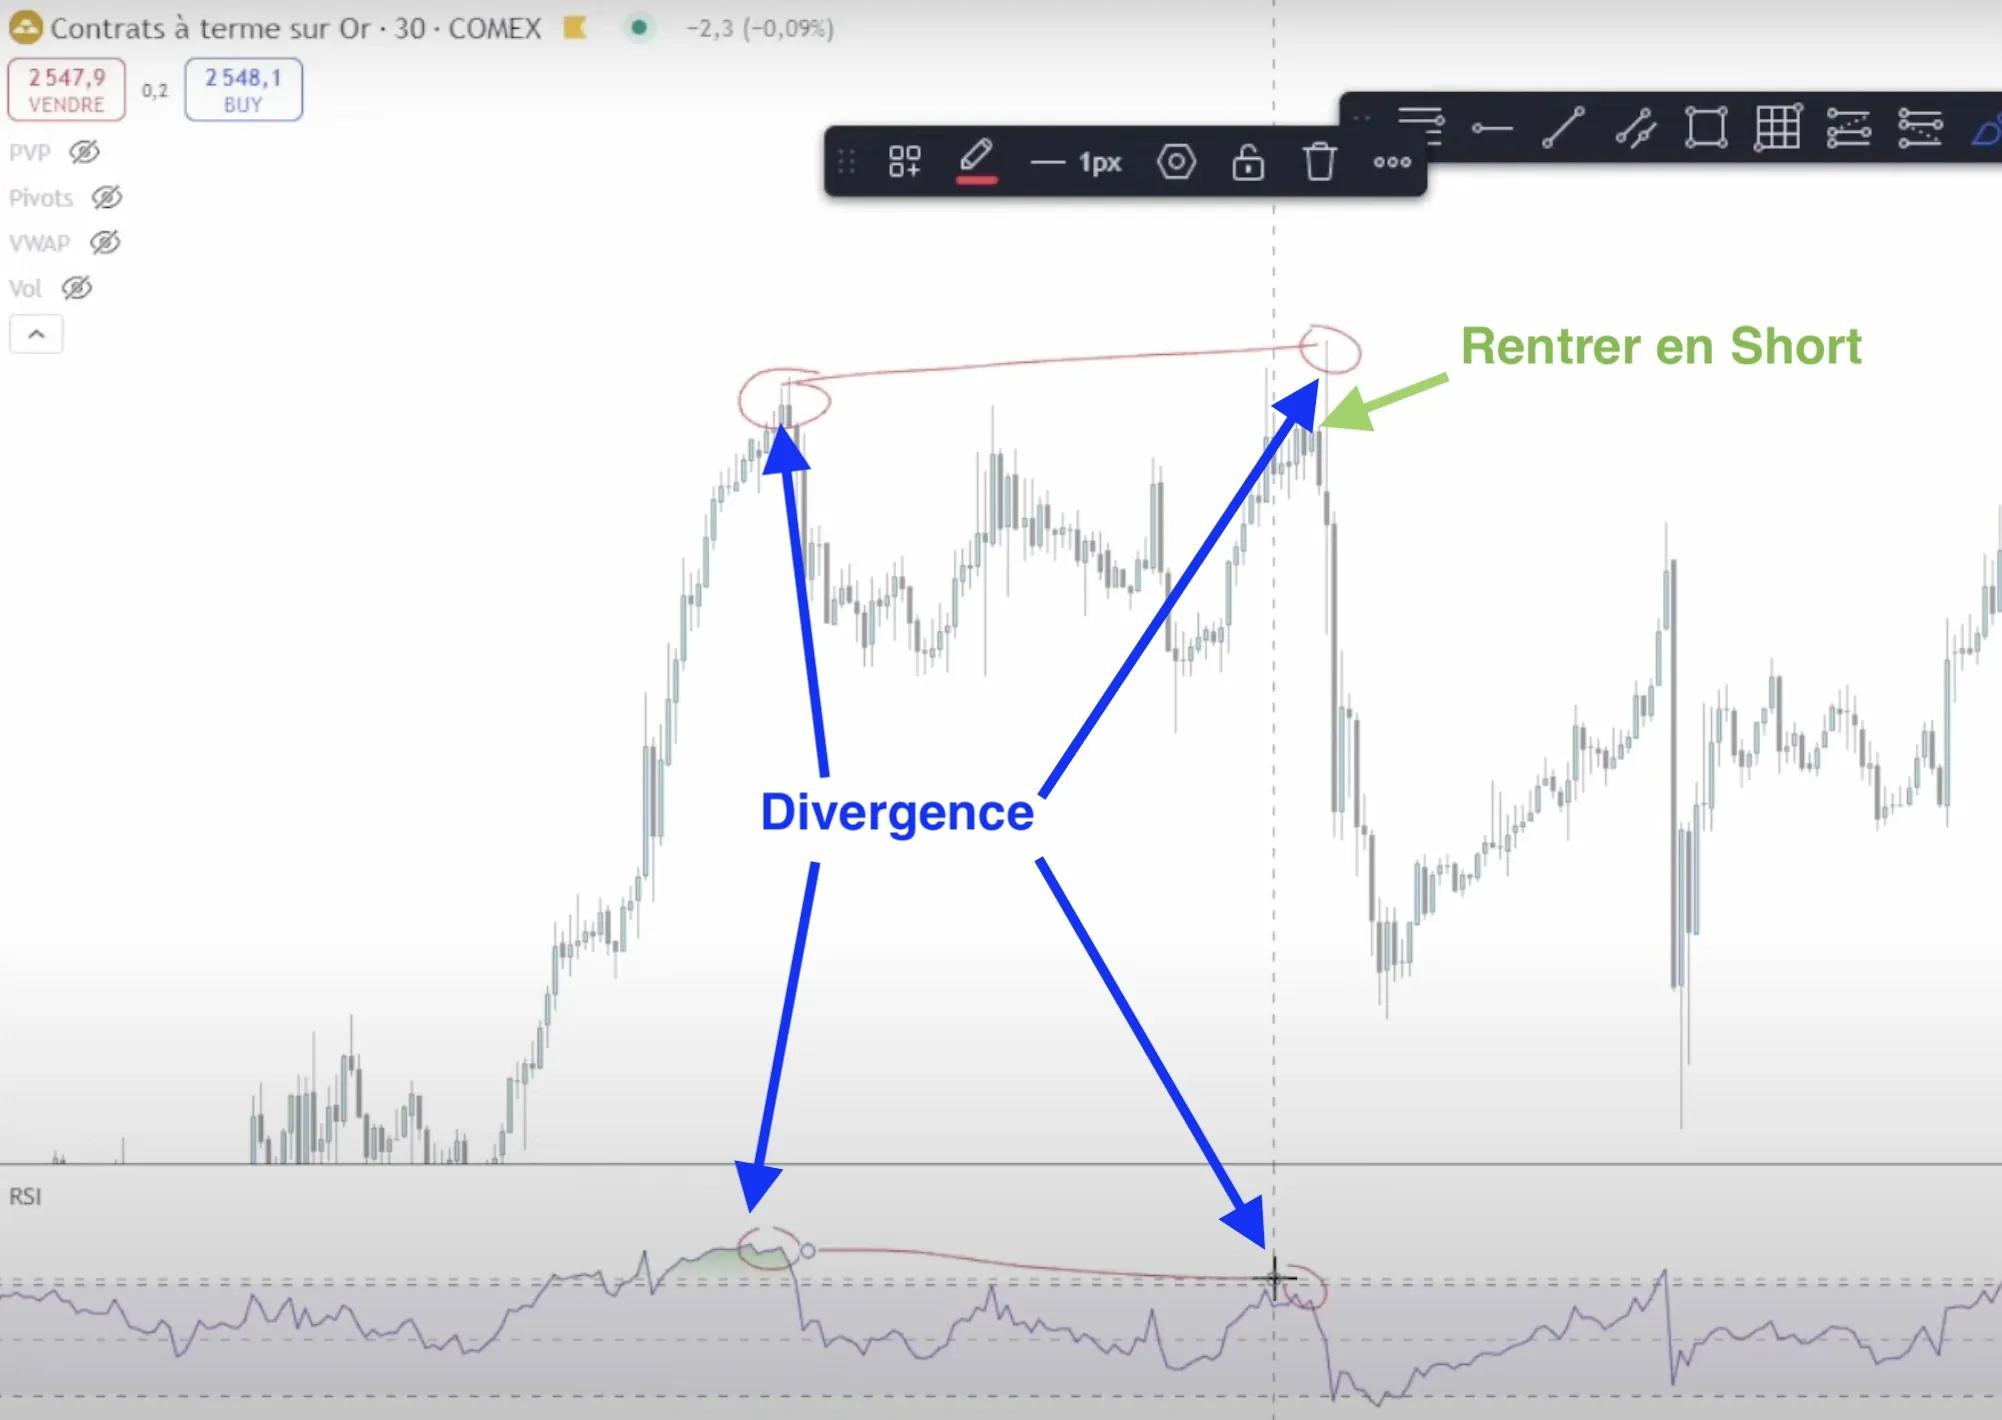
That's a bearish divergence that could signal a reversal.
Gold reaches a new high, but the RSI below forms a lower peak than before.
It's a potential signal to go short, because it may indicate that the upward move is losing strength and a downward reversal is possible.
3. Identify trends
Some traders use the RSI's 50 level to trade with the trend.
- If the RSI stays above 50, they buy
- If it stays below 50, they sell
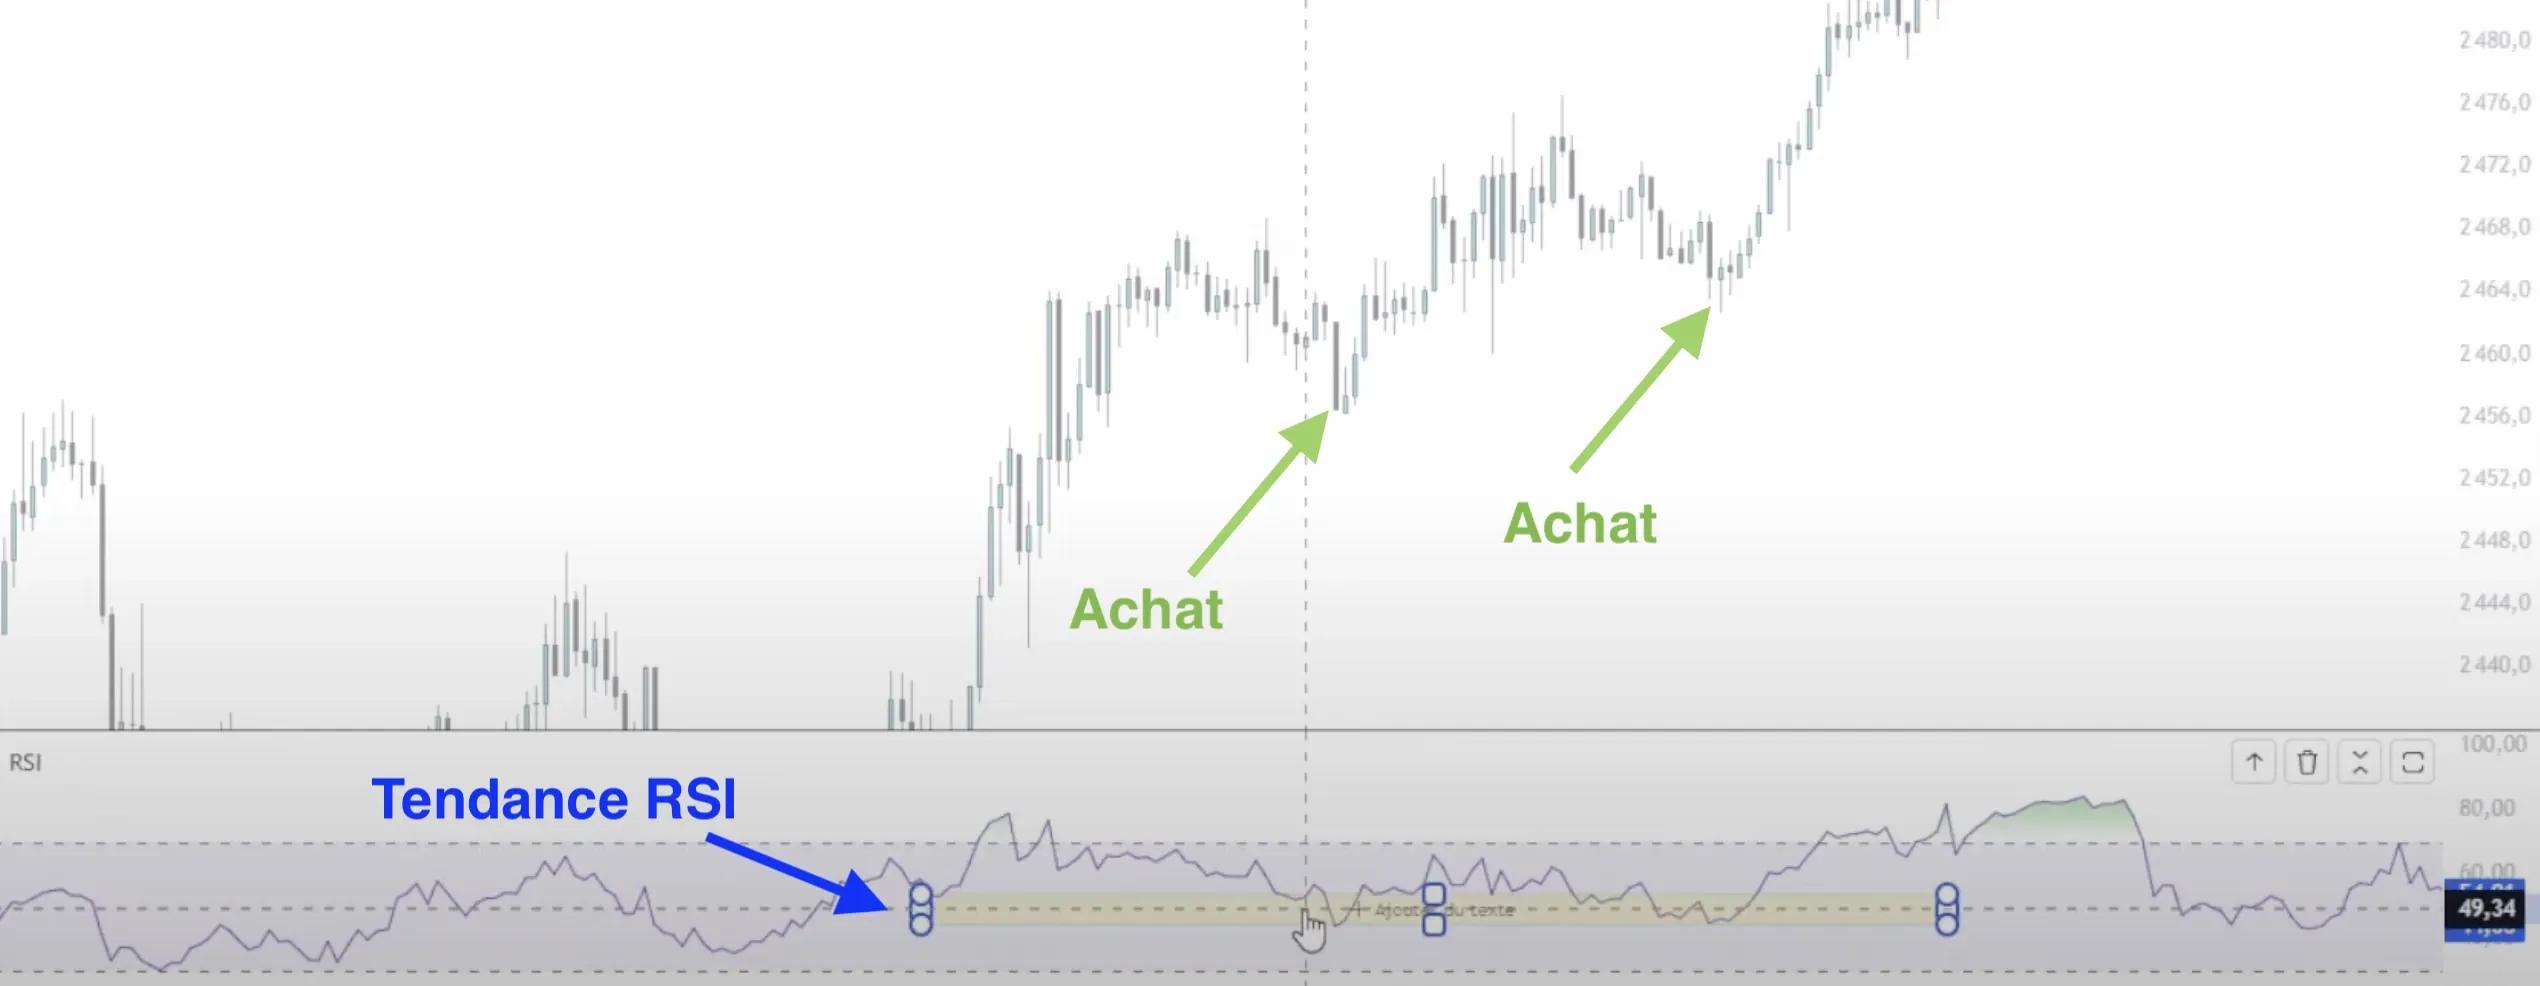
For example, if you're trading EUR/USD and the RSI stays above 50 for several days, that can indicate a solid uptrend.
You can look for buying opportunities whenever the RSI pulls back towards 50.
How is the RSI calculated?
I won't go into all the calculation details, but here's an overview:
- Take a given period, usually 14 periods
- Calculate the average gains and average losses over it
- Compare the two averages to get a ratio
- Normalise that ratio into an indicator between 0 and 100
The idea is to compare the relative strength of gains against losses.
If gains are much stronger than losses on average, the RSI will be high, or overbought. And vice versa.
