
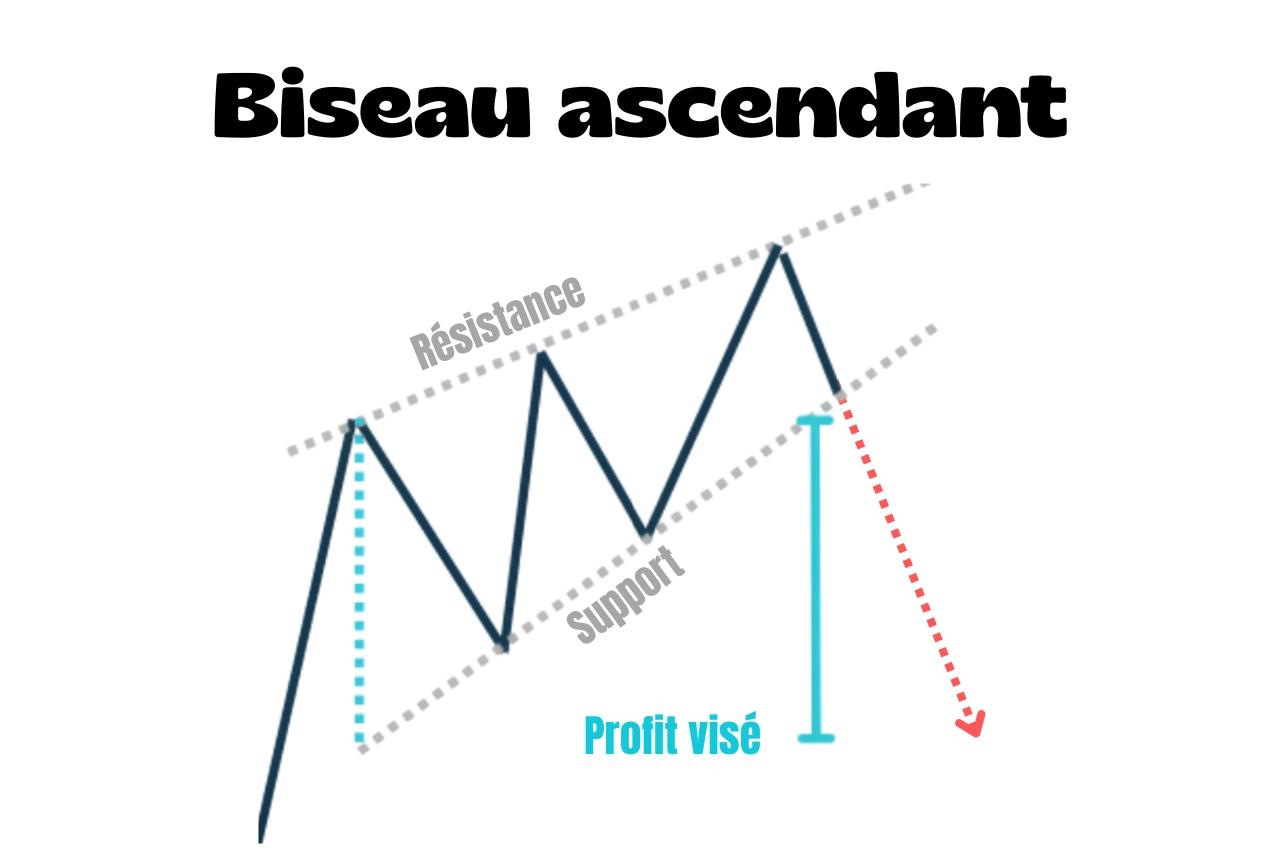
A rising wedge is a bearish reversal chart pattern that forms at the end of an uptrend.
✅
Two upward-sloping trendlines converge towards the same point: support rises faster than resistance.
Price keeps rising, but the gap between the two lines narrows with each wave.
How do you recognise a rising wedge?
Several features help you spot it:
- An uptrend before the pattern
- Upward-sloping resistance and support that converge
- Support with a steeper slope than resistance
- Each new rise is smaller than the last
- Price breaks below support
⚠️
Don't confuse a rising wedge with an ascending triangle, which has horizontal resistance.
How do you trade it?
Chart traders wait for a break below support as their short-entry signal.
They set the take-profit by projecting the wedge's height downwards from the breakout point.
That height is the distance between resistance and support at the start of the wedge.
The stop-loss goes above the last high before the breakout.
The falling wedge works the other way round.
