
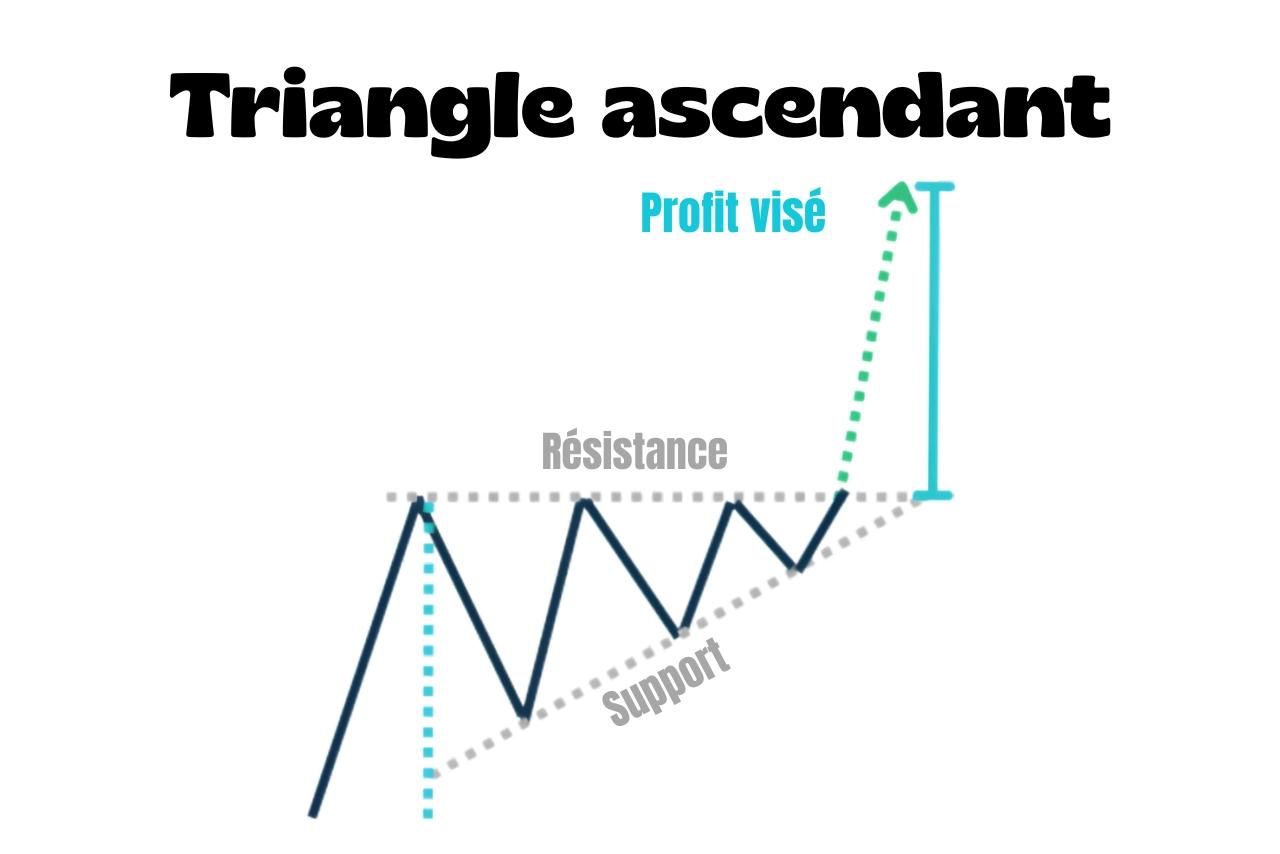
An ascending triangle, also called a bullish triangle, is a bullish continuation chart pattern.
It forms when price repeatedly stalls below the same horizontal resistance while making higher lows.
This shows gradual accumulation. Sellers keep defending the same area, but buyers step back in earlier after each pullback.
How do you recognise it?
- An uptrend comes before the pattern
- Price tests the same horizontal resistance several times. This distinguishes it from a bullish pennant, where the upper boundary slopes
- Each low is higher than the last, forming rising support
- Each line needs to be tested at least twice to confirm the pattern
Don't confuse an ascending triangle with a rising wedge. In a rising wedge, both resistance and support slope upwards, and the pattern signals a bearish reversal.
How do you trade an ascending triangle?
The standard strategy is to wait for a break above resistance.
There are two ways to enter:
- When price breaks through resistance
- When price returns to the old resistance, if it is retested as support
The stop can go below the most recent higher low.
If you enter after a retest, you can also place it below the breakout area.
You can set the take-profit by projecting the triangle's height above the breakout point.
