
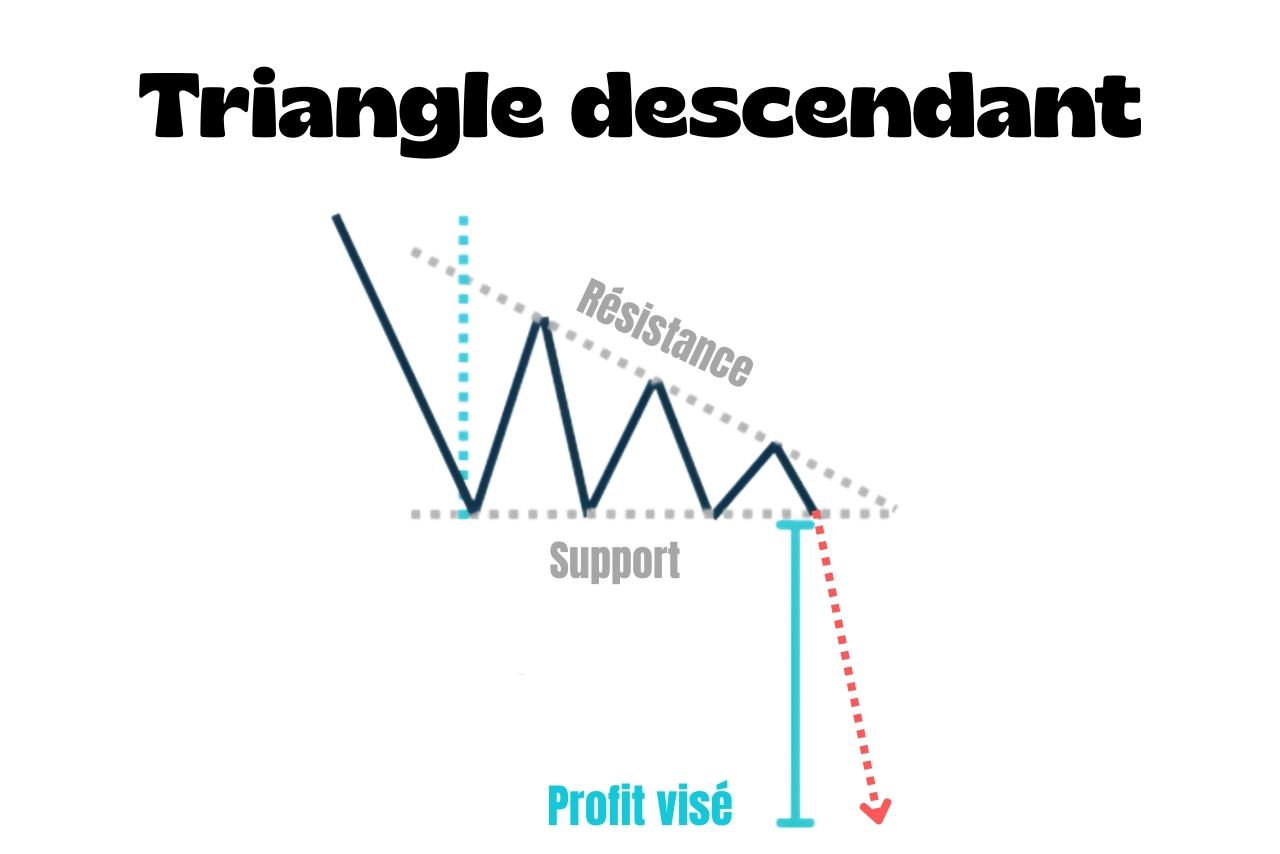
A descending triangle, also called a bearish triangle, is a bearish continuation chart pattern.
✅
It forms when price repeatedly tests the same horizontal support but fails to rebound as high as before.
Unlike an ascending triangle, it reflects selling pressure in the market.
How do you recognise a descending triangle?
- The pattern appears in a downtrend
- Each successive rebound reaches a lower high
- The upper boundary is downward-sloping resistance, while the lower boundary stays horizontal
- In practice, price should touch each line at least twice
⚠️
Don't confuse a descending triangle with a bearish pennant, which has a shorter consolidation between two sloping boundaries.
How do you trade it?
You can enter directly on the break below support, or on a retest of the old support if it becomes resistance.
The stop-loss usually goes above the most recent lower high.
If you enter after a retest, you can also place it just above the retest area.
You can set the take-profit by projecting the triangle's height below the breakout point.
