
✅
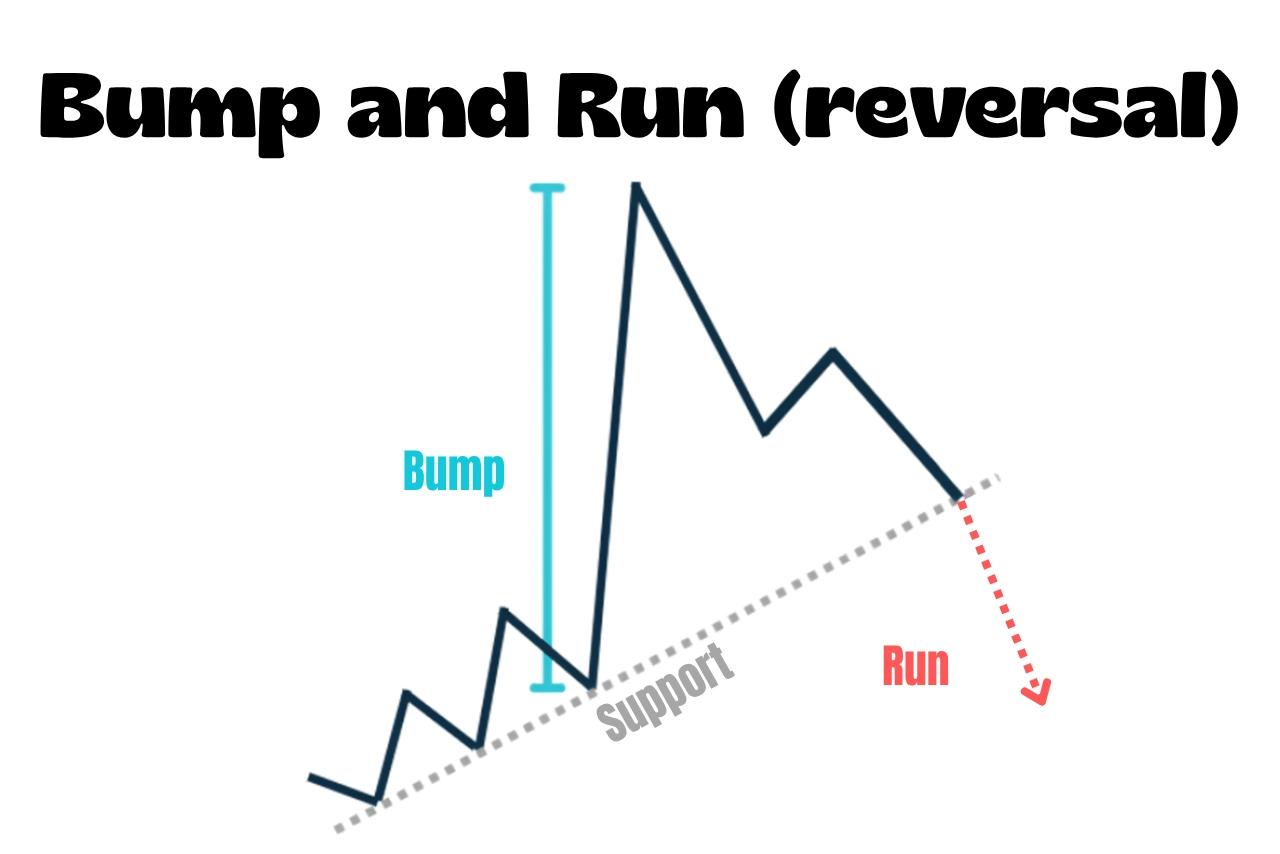
The bump and run reversal is a bearish reversal chart pattern.
How do you recognise it?
It forms in a rising market and has three identifying features:
- Price moves above rising support: before the pattern appears, price bounces off this line several times
- The rise accelerates: price starts climbing more sharply, forming the bump
- Price falls back and breaks support: after the rise, price drops back towards support. The pattern is confirmed when it finally breaks through, forming the run
⚠️
Don't confuse it with a V top, which forms a more direct, symmetrical peak.
The bump and run reversal first develops above rising support before reversing.
How do you trade a bump and run reversal?
The simplest strategy is usually to wait for the break below support before entering short.
The stop-loss goes above the pattern's highest point, with the take-profit at its previous low.
Note: there is also an opposite version, called the bump and run.
