
✅
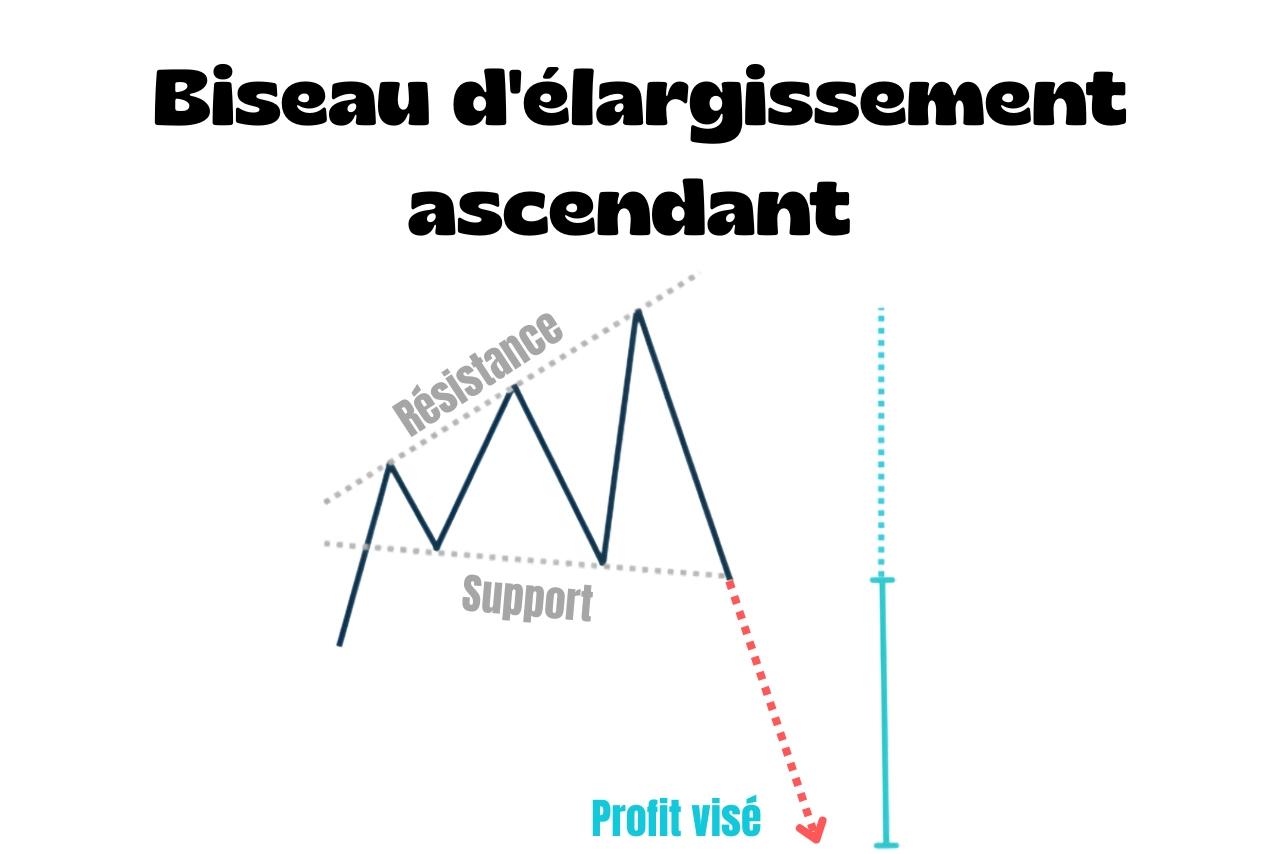
An ascending broadening wedge is a bearish reversal chart pattern.
How do you recognise it?
- An uptrend comes before the pattern
- Price moves between two diverging, upward-sloping trendlines: support and resistance
- Price forms higher highs and higher lows with increasingly wide swings
- The pattern is confirmed when price breaks below support
⚠️
Don't confuse an ascending broadening wedge with a rising wedge.
In a standard rising wedge, the two lines converge.
Here, they diverge: the pattern gets wider as price rises.
How do you trade an ascending broadening wedge?
Chart traders wait for the break below support as their short-entry signal.
They usually place the stop-loss above the most recent high formed inside the wedge.
For the take-profit, they project the wedge's maximum height below the breakout point.
How is it different from a descending broadening wedge?
Both patterns follow the same principle: two diverging lines moving further apart.
The difference is their direction.
In a descending broadening wedge, both lines point downwards and the pattern signals a bullish reversal.
