
✅
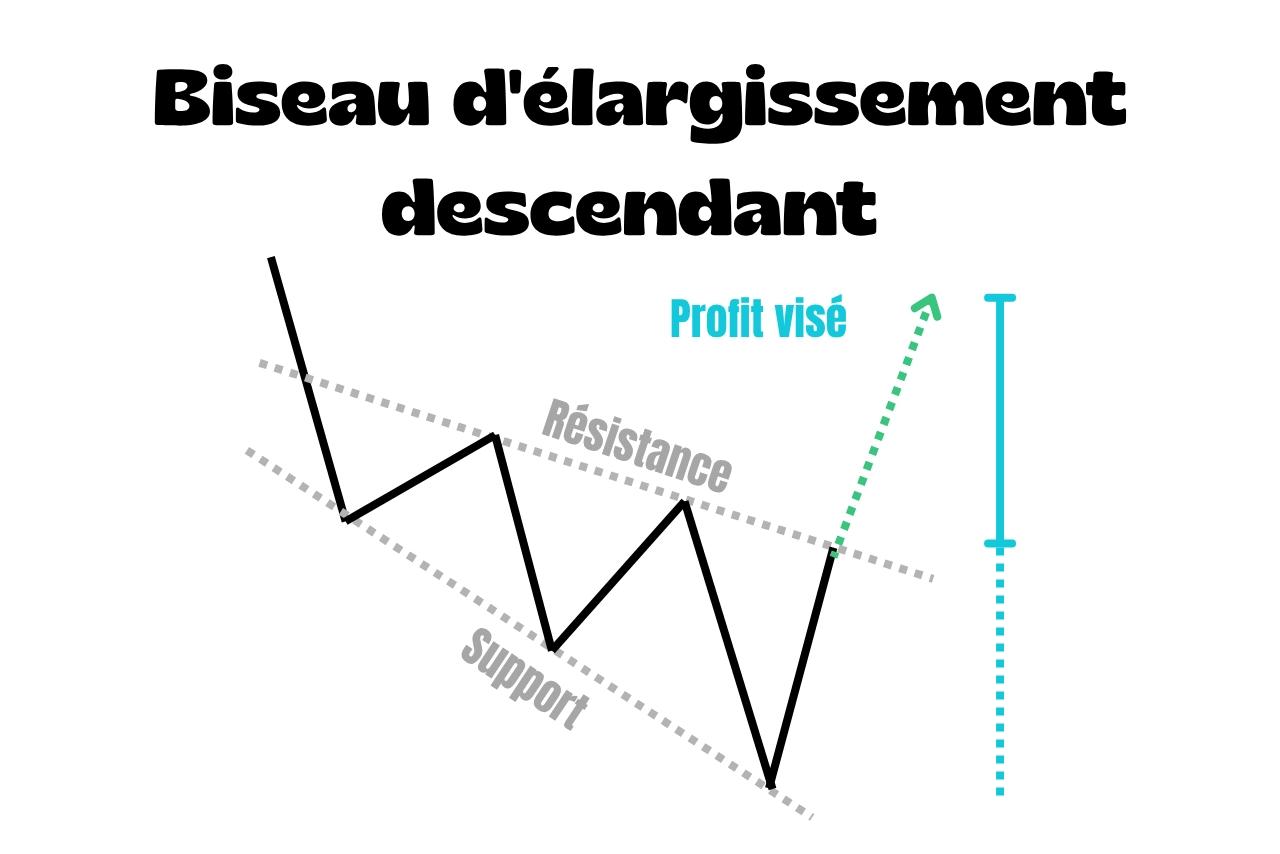
A descending broadening wedge is a bullish reversal chart pattern.
How do you recognise it?
- The pattern should appear in a downtrend
- Price moves between two downward-sloping lines, support and resistance, that gradually move further apart
- Price swings become wider and wider
- The pattern is confirmed when price breaks above resistance
⚠️
Don't confuse a descending broadening wedge with a standard falling wedge, where the two lines converge.
How do you trade a descending broadening wedge?
Chart traders generally wait for a break above resistance as their long-entry signal.
The stop-loss often goes below the most recent low within the pattern.
For the take-profit, they usually project the wedge's maximum height above the breakout point.
How is it different from an ascending broadening wedge?
In an ascending broadening wedge, both lines slope upwards and the pattern signals a bearish reversal.
Here, both lines point downwards and the breakout is usually upwards.
