
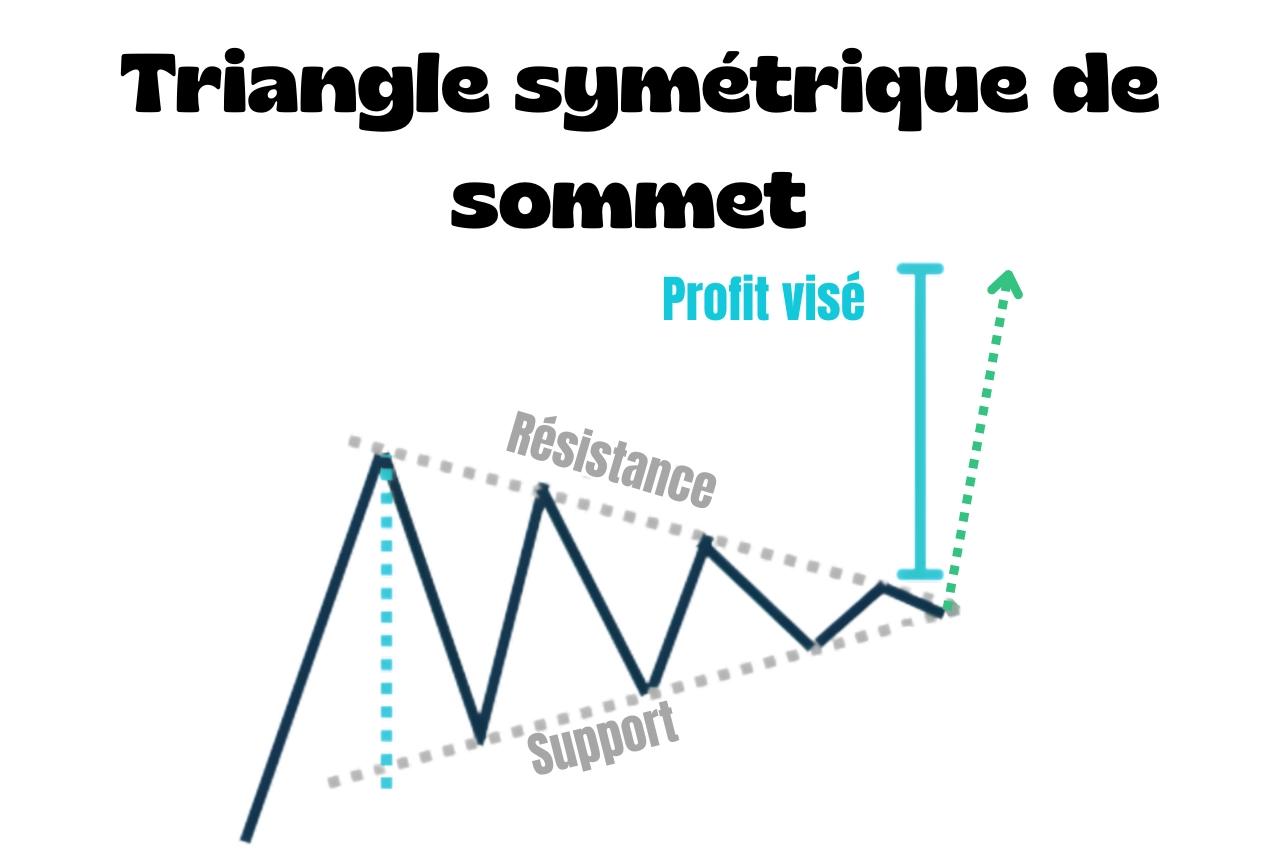
A bullish symmetrical triangle is a bullish continuation chart pattern.
How do you recognise it?
Several features help you identify it:
- An uptrend comes before the pattern
- Price swings between falling resistance and rising support, which gradually narrow into a symmetrical triangle
- A break above resistance confirms the pattern
A bullish symmetrical triangle looks similar to a bullish pennant, but they're different patterns.
A pennant usually follows a sharp, rapid move that forms a clear pole. A symmetrical triangle develops more gradually.
How do you trade it?
You can enter long on the break above resistance.
The stop-loss usually goes below the most recent low inside the pattern, or below the triangle's support.
For the take-profit, measure the height of the triangle's base and project that distance above the breakout point.
As with other chart patterns, the idea is to wait for the breakout rather than enter in anticipation of it.
There is also a bearish version: the bearish symmetrical triangle.
