
✅
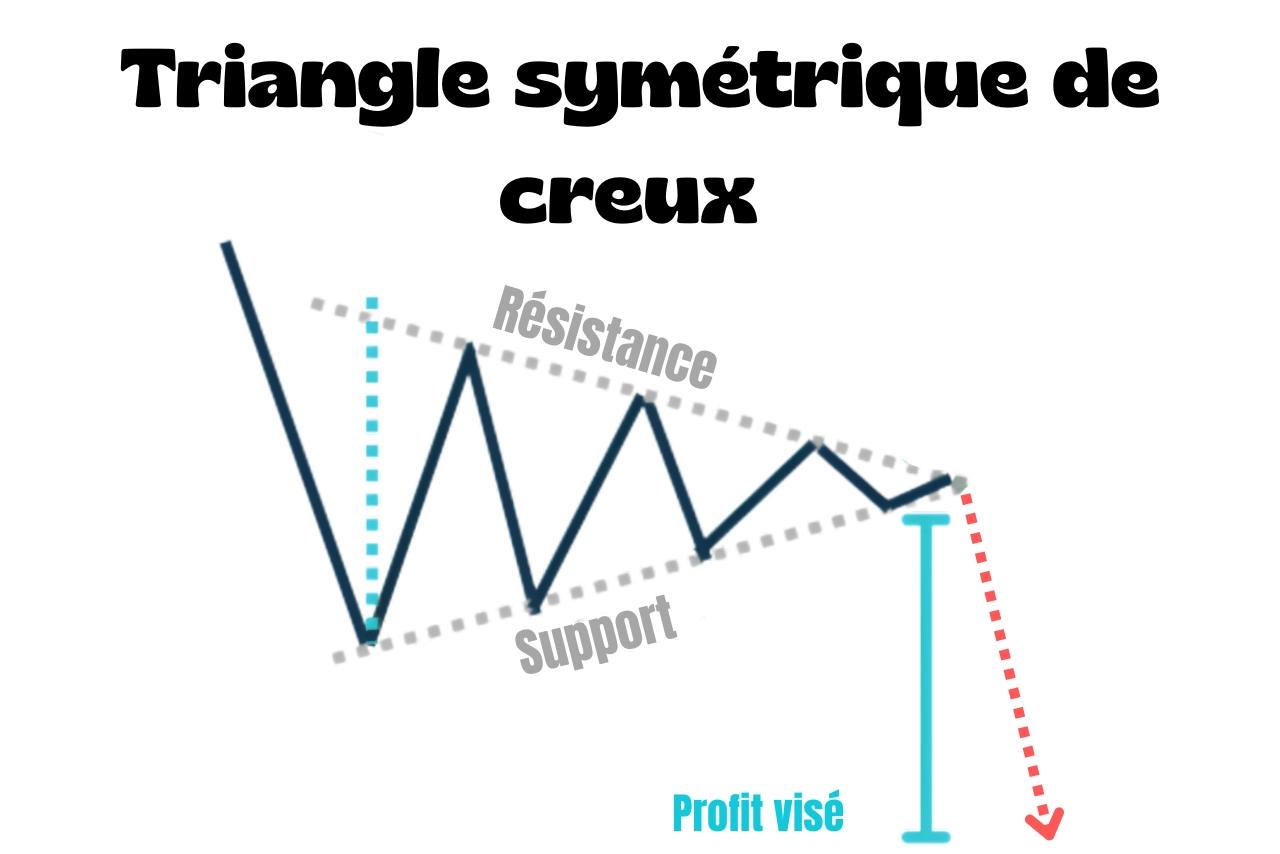
A bearish symmetrical triangle is a bearish continuation chart pattern.
How do you identify it?
- The pattern appears in a downtrend
- Price moves between rising support and falling resistance, which gradually converge into a symmetrical triangle
- The pattern is confirmed when price breaks below support
⚠️
A bearish symmetrical triangle can look like a bearish pennant, but the two setups aren't the same.
A bearish pennant follows a very sharp move, forming a pole, then a short consolidation.
How do you trade it?
The simplest strategy is to wait for a break below support before entering short.
The stop-loss usually goes above the most recent high inside the pattern, or above the triangle's resistance.
For the take-profit, measure the height of the triangle's base, then project that distance below the breakout point.
There is also a bullish version: the bullish symmetrical triangle.
