
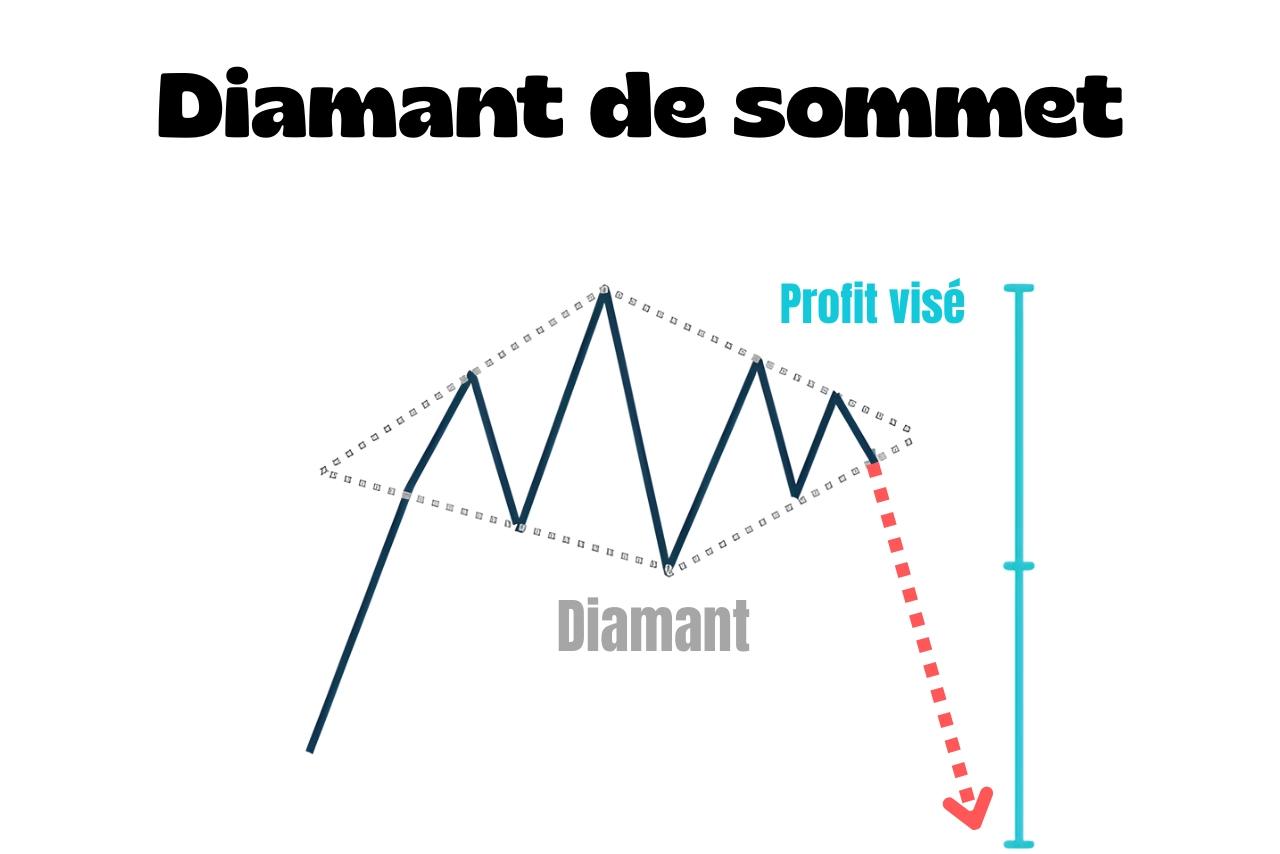
A diamond top is a bearish reversal chart pattern.
✅
It appears after an uptrend and signals that buyers are losing control.
Its opposite is the diamond bottom, which forms at the bottom of a trend and signals a bullish reversal.
How do you recognise a diamond top?
✅
Viewed as a whole, the pattern traces out a diamond shape.
You can check four things to confirm it:
- The market is rising before the pattern appears
- In the first half, each new high is higher than the last and each new low is lower than the last
- In the second half, each new high is lower than the last and each new low is higher than the last
- A downward break through the bottom of the diamond confirms the signal
How do you trade it?
The sell signal appears when price breaks the diamond's lower boundary on the right-hand side.
Enter after a candle closes below that boundary.
The stop-loss can go above the last visible high before the breakout.
Calculate the target by measuring the diamond's maximum height and projecting that distance below the breakout point.
