
What is order flow trading?
Order flow trading means studying the market through orders, transactions and executed volume, rather than looking only at price movements.
It uses tools such as the order book, DOM, tape, footprint charts and Volume Profile.
Order flow and technical analysis
Traditional technical analysis uses past prices to anticipate possible market moves.
Order flow looks at the activity behind the movements you see on the chart.
The two approaches aren't mutually exclusive, and many traders use them together.
This table summarises their main differences.
| Feature | Technical analysis | Order flow |
|---|---|---|
| Data used | Past prices: candles and indicators | Orders executed in real time |
| When you read it | After the candle has formed | While the candle is forming |
| What you observe | The result of the move | The orders behind the move |
| Main use | Identifying areas and trends | Confirming an area in real time |
| Best-suited markets | All markets | Centralised markets, particularly futures |
What order flow analyses
Order flow examines resting orders, executed trades and the price reaction.
Resting orders represent available liquidity, while transactions show the buying and selling that actually took place.
By comparing that activity with price movement, order flow helps identify which side is taking the initiative, whether opposing liquidity is absorbing trades and whether the move is continuing or slowing down.
The best markets for order flow
Order flow is most useful in markets where the available data represents a meaningful share of activity.
Traders mainly use it in futures markets.
Trades go through an organised, centralised market.
The order book, volume and executions therefore give participants a shared view of market activity.
Analysis is still possible in other markets, such as CFDs or crypto, but the available information is often less complete or specific to each platform.
You can still use order flow there, provided you account for that limitation when interpreting it.
Key order flow concepts
Several concepts help you interpret the activity shown by order flow tools.
They help you determine which side is taking the initiative, where orders are being absorbed and whether a move is continuing or starting to slow.
Balance
A market is balanced when buyers and sellers trade at the same price levels without either side clearly gaining the upper hand.
During these phases, price moves within an area with no clear direction.
This can continue until buying or selling becomes more dominant.
Imbalance
An imbalance is a marked difference between buying and selling activity at a given level.
It indicates that one side is more active than the other.
Aggression
Aggression refers to market orders that execute immediately against available limit orders.
Aggressive buying executes against sell orders; aggressive selling executes against buy orders.
These orders can move price if the quantity available on the other side isn't enough to absorb them.
Delta
Delta measures the difference between aggressive buying and aggressive selling in a particular area, candle or period:
- Positive delta shows aggressive buyers dominate
- Negative delta shows aggressive sellers dominate
Cumulative delta
Cumulative delta, or CVD, applies the same logic over time.
It adds up delta candle by candle to show whether buying or selling pressure is accumulating during a session.
It can help reveal divergences between price and aggressive activity.
When price rises while CVD falls, it may indicate declining aggressive buying despite the price increase.
Absorption
Absorption happens when a large volume of market orders executes on one side, but price moves little or not at all.
That can indicate liquidity on the other side is absorbing the activity.
Order flow tools
The order book and DOM
The order book displays visible limit orders waiting at different price levels.
DOM, or Depth of Market, presents this information in an interface that lets you observe liquidity and execute orders in real time.

Displayed liquidity isn't guaranteed. Orders can be changed, cancelled or filled before price reaches their level.
You therefore need to analyse the DOM alongside actual executions and the price reaction.
The tape
The tape is the stream of trades that have actually executed.
Unlike the order book, which shows orders still waiting, the tape shows what really traded in the market.

Reading it means watching the speed, size and repetition of executions, along with the price reaction.
For example, large buys can execute without price rising.
That may indicate sellers are absorbing buying pressure.
Conversely, if buys come in rapid succession and price keeps rising, it can indicate sustained buying activity.
Footprint charts
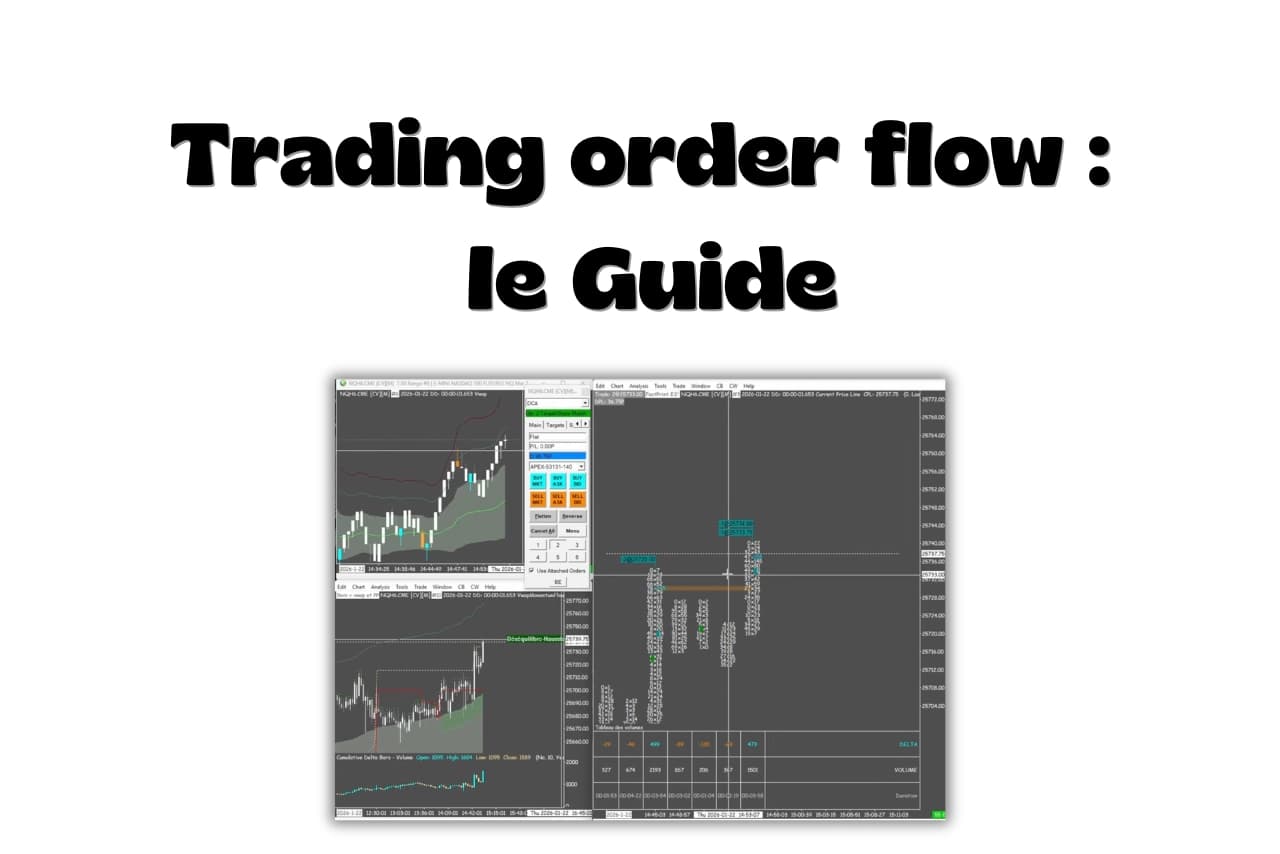
Footprints display traded volume at each price level within a candle.
A standard chart mainly shows the candle's final result. A footprint details how trading was distributed while it formed.

A footprint can help identify:
- Buyer and seller imbalances
- Absorption
- Exhaustion of a move
- Areas where traders may be trapped
Volume Profile
Volume Profile shows volume traded at each price level over a given period.
It provides a broader view of market context.
It highlights areas of heavy activity, levels where the market spent time trading and areas with little executed volume.

VWAP
VWAP calculates the volume-weighted average price over a session.
Institutional participants and some algorithms often use it as a reference.
In order flow, it helps you compare price with its average traded price and measure the distance between them.
Read this article to learn how to use VWAP and Volume Profile together.
Using order flow in an analysis
Order flow helps you confirm or invalidate a trading idea using activity observed in real time.
Prepare the scenario
Start by analysing the context and identifying an area where you might take a position.
Decide what you expect the market to do there, along with the conditions that would invalidate your scenario.
Confirm or invalidate the idea
When price reaches the area, check whether the activity you observe matches your analysis.
Depending on the situation, you may do this before making the decision or at the moment of entry, particularly when scalping.
Make a decision
If the context and observed information support the idea, you can enter with a defined invalidation level.
Otherwise, wait for a better opportunity or abandon the scenario.
In the video below, I show how I use order flow during a futures scalping session to analyse the market and choose my entries.
Platforms suited to order flow
Order flow analysis requires a platform that can display volume by price, footprint charts and the DOM in real time.
Sierra Chart, NinjaTrader and ATAS are among the platforms most commonly used by futures traders.
- Sierra Chart is known for reliability and data quality. Its interface is more demanding and better suited to traders with some order flow experience. It's the one I use
- NinjaTrader is well established in the futures prop firm world. Footprint charts are available through add-ons
- ATAS brings together footprints, Volume Profile, cumulative delta and the DOM in a more accessible interface
These platforms require access to data from the relevant exchange.
In futures, that data feed often carries a fee on top of the platform subscription.
Learning order flow
Order flow is one of the most demanding approaches to trading.
The concepts are accessible, but reading the market in real time takes practice.
It generally takes several months to become comfortable with it.
Most traders who jump in too quickly end up watching too much information at once, without knowing what to prioritise.
It's generally easier to start with volume and Volume Profile, then add delta and CVD.
Footprints and the tape can come later, once you've mastered the basics.
In my course, I teach this progression, starting with volume and working towards a more precise reading of execution.
