
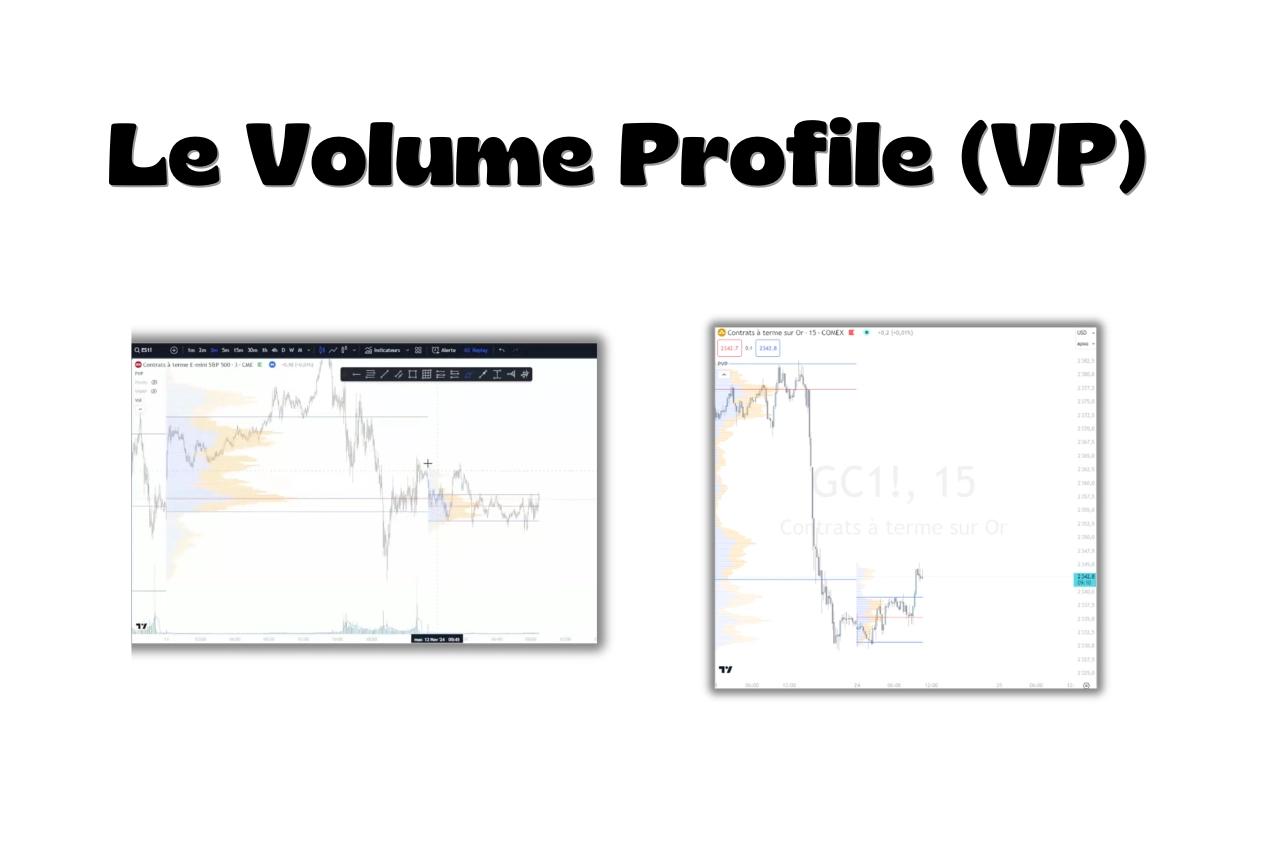
What is Volume Profile?
Volume Profile (VP) is a trading indicator that displays total traded volume at each price level over a given period.
Unlike traditional volume indicators, which appear as vertical bars below the chart, Volume Profile sits beside the chart as a horizontal histogram.
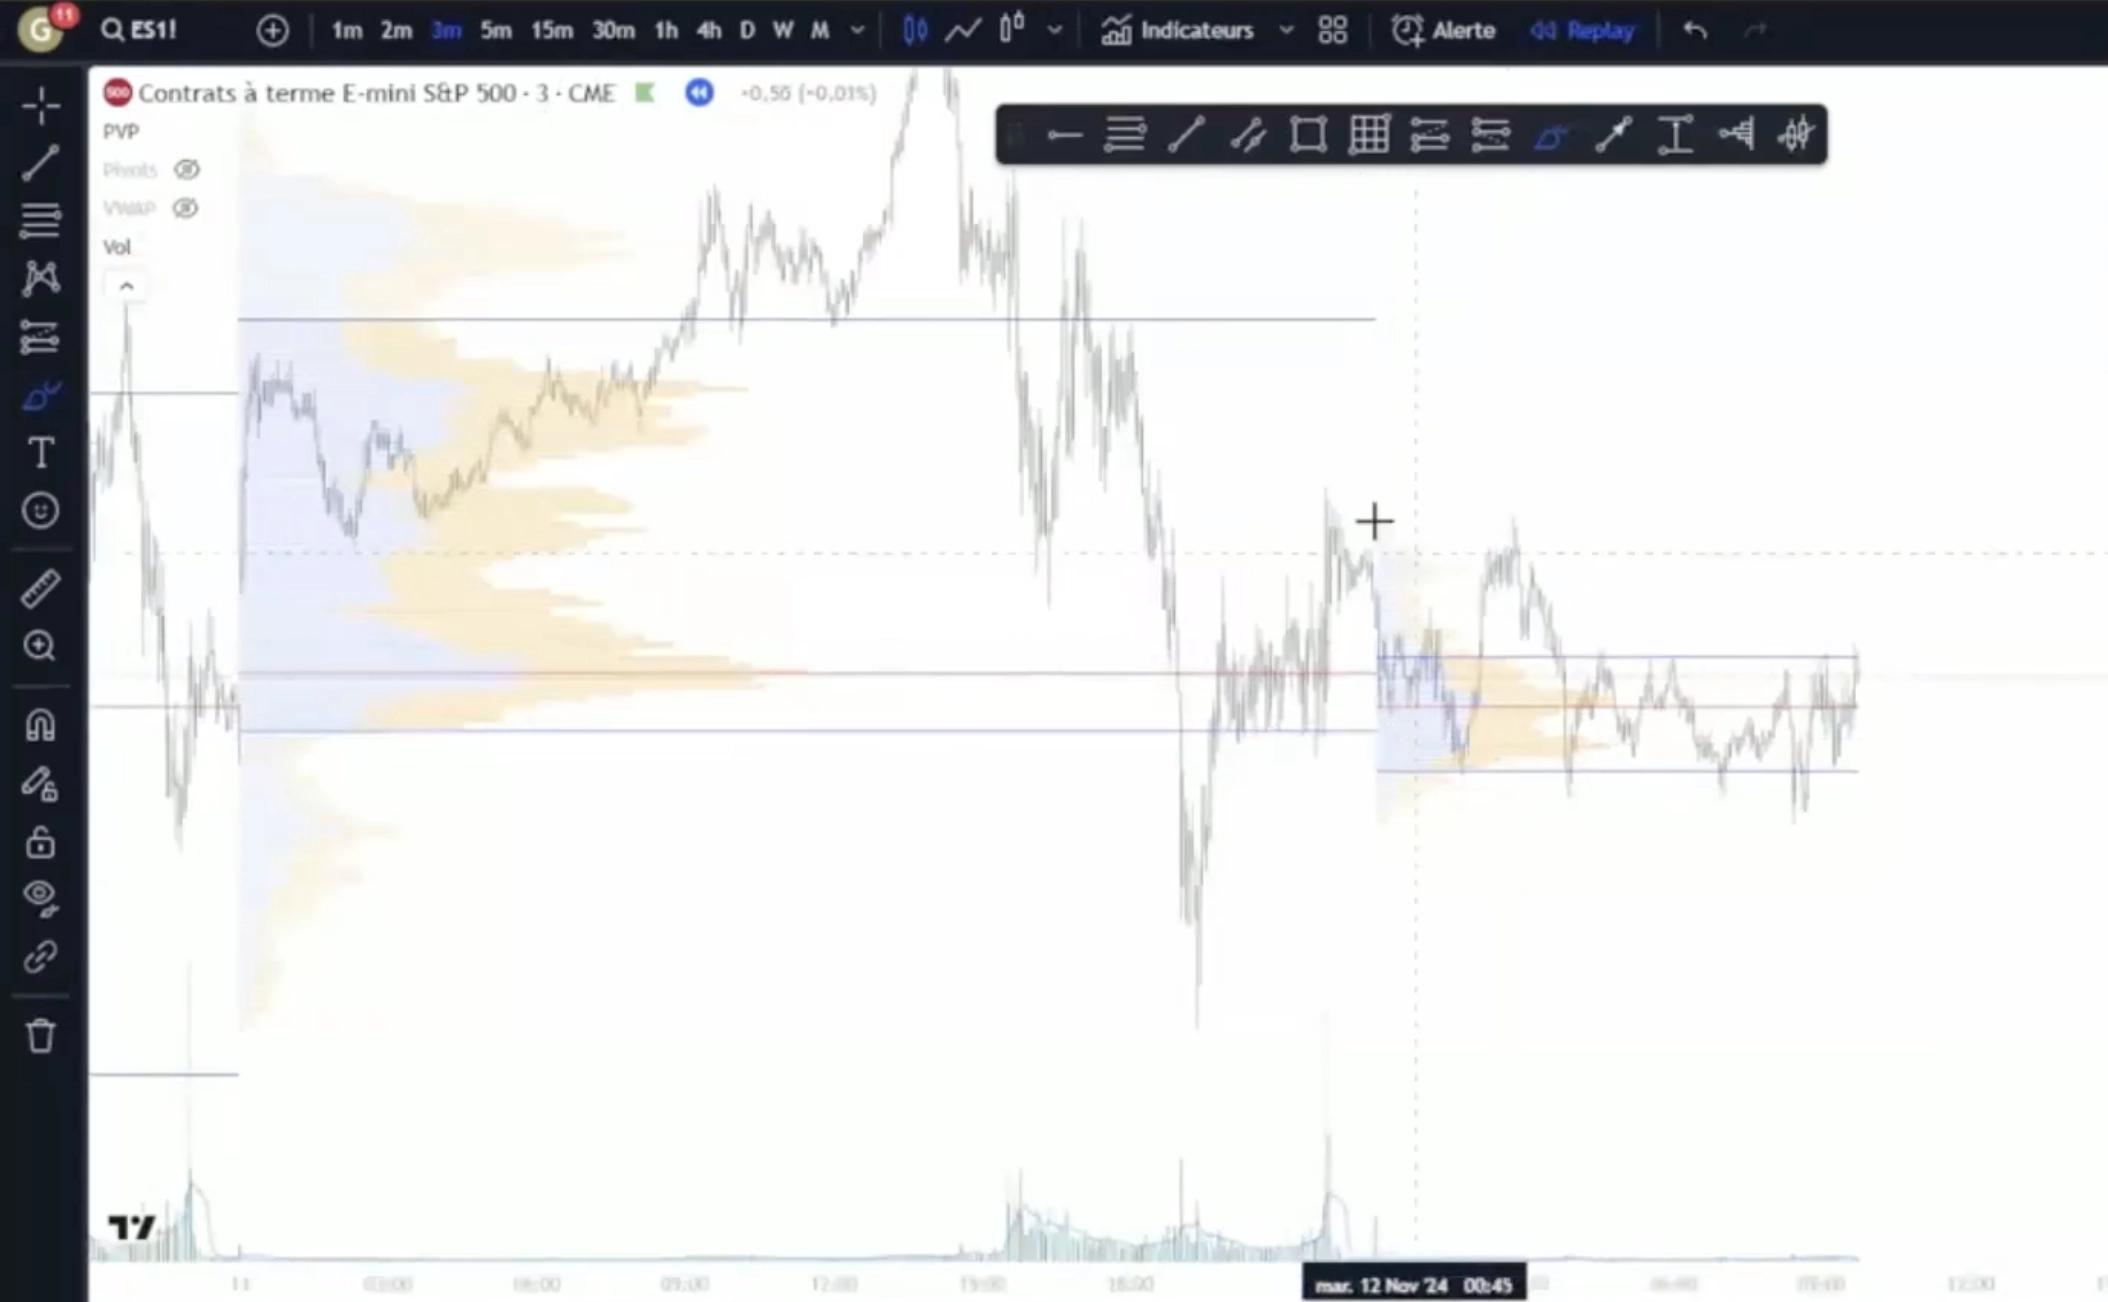
This distribution helps traders identify the price areas where the most trading took place.
It also shows price levels where little or no volume traded.
How is Volume Profile calculated?
Volume Profile aggregates all trades executed over a given period, then groups them by price level.
For each price, it adds up all traded volume, whether buying or selling, and displays the result as a horizontal bar.
The longer the bar, the more volume traded at that level.
In practice, you don't need to calculate anything yourself. TradingView and other platforms handle it automatically.
What are the benefits of Volume Profile?
Knowing where trading actually concentrates is valuable information in technical analysis.
Volume Profile helps you define entry and exit levels based on the actual distribution of volume, rather than price highs and lows alone.
You're looking at where the market has actually done business.
Volume is too important to ignore, and Volume Profile makes it visual and straightforward.
That's why many traders use it alongside VWAP, which also provides a volume-based view of the market.
I explain how to combine them in this article.
How do you read Volume Profile on a chart?
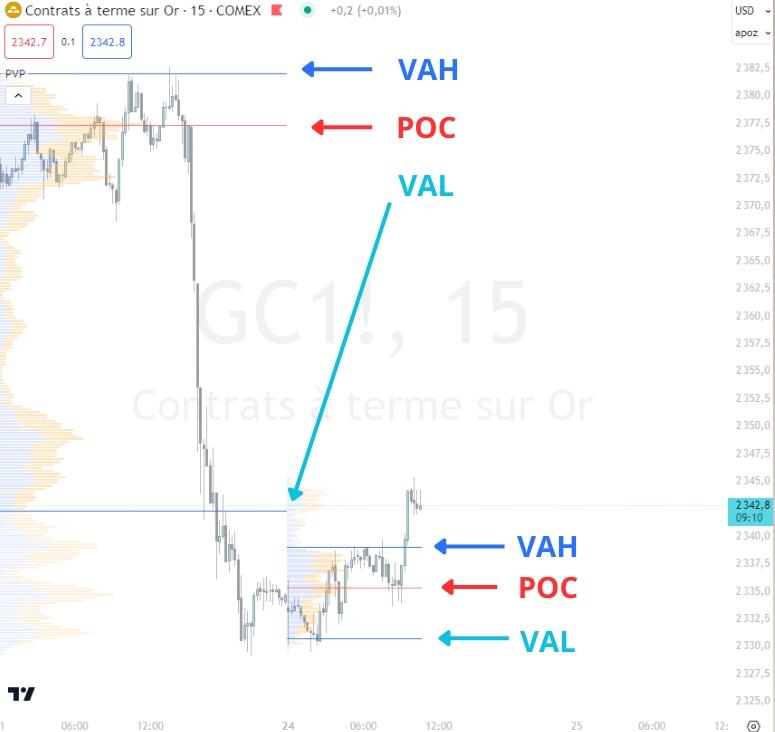
Volume Profile has three main elements:
1) The volume histogram
On the left of the chart, horizontal bars represent the volume traded at each price level.
A long bar means high volume at that price. A short bar means low volume.
2) The POC, or Point of Control
This is the red line running through the histogram.
It marks the price with the most traded volume during the period analysed.
This level attracted the most trading activity, making it a major point of interest.
3) The Value Area
These are the two blue lines marking out an area.
They show the price range within which 70% of the volume traded.
- VAH, Value Area High: the upper boundary
- VAL, Value Area Low: the lower boundary
There is one Volume Profile for each period.
Set it to daily, and a new VP forms each day.
Set it to weekly, and it resets each week.
My TradingView settings
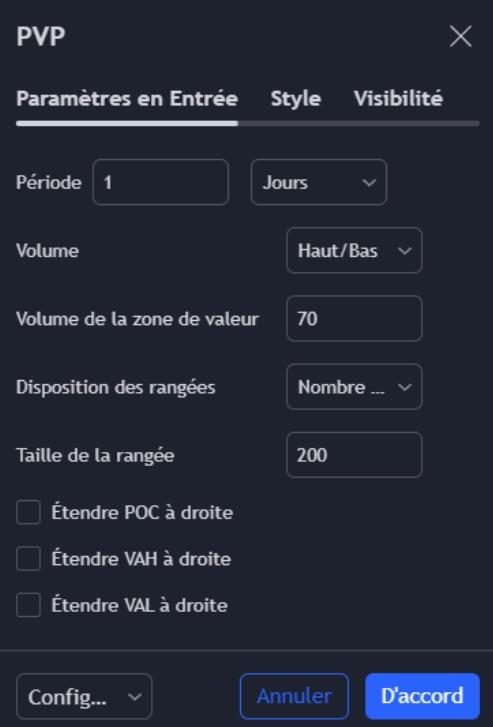
Here's how I configure Volume Profile on the platform.
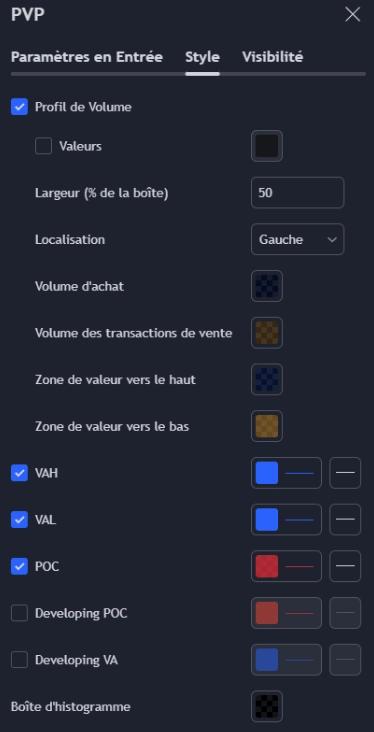
Style tab
This is where you customise its appearance: the colour and width of the POC, VAH and VAL, the histogram colour and the background colours of the areas.
A chart overloaded with colours is hard to read, so I prefer muted colours that don't get in the way of my analysis.
Inputs tab
This is where you set the main parameters.
- Period: choose a daily, weekly, monthly or other Volume Profile. I often leave it on "Days" so it renews each day
- Value Area Volume: the size of the area marked by the blue lines. The default is 70%, meaning this area contains 70% of the volume. I leave it as it is
- Row Size: this controls the histogram's width, which you can adjust to your visual preferences
You can also enable options to extend the POC, VAH and VAL to the right, which is useful if you want to see those levels carried forward across later candles.
3 ways I take Volume Profile further
1) When I notice an upward price imbalance
I use the POC as support to identify a potential entry area.
If price is above the POC and comes back to it, I can look for a bounce.
Conversely, in a downward imbalance, that same POC can act as resistance.
2) I compare previous days' Volume Profiles
When the POCs from several days sit in the same price area, I consider that level a genuine equilibrium price: an area where the market accepts doing business.
I then wait for an opportunity to trade a return to that area or a clear break of the level.
3) I like looking at a 60-day Volume Profile
Alongside the daily Volume Profile, I sometimes display one covering the last 60 days.
That lets me see the main trading areas over the past two months and, above all, identify price levels the market rejected or barely traded.
Price often moves quickly through these low-volume areas when it returns to them.
