
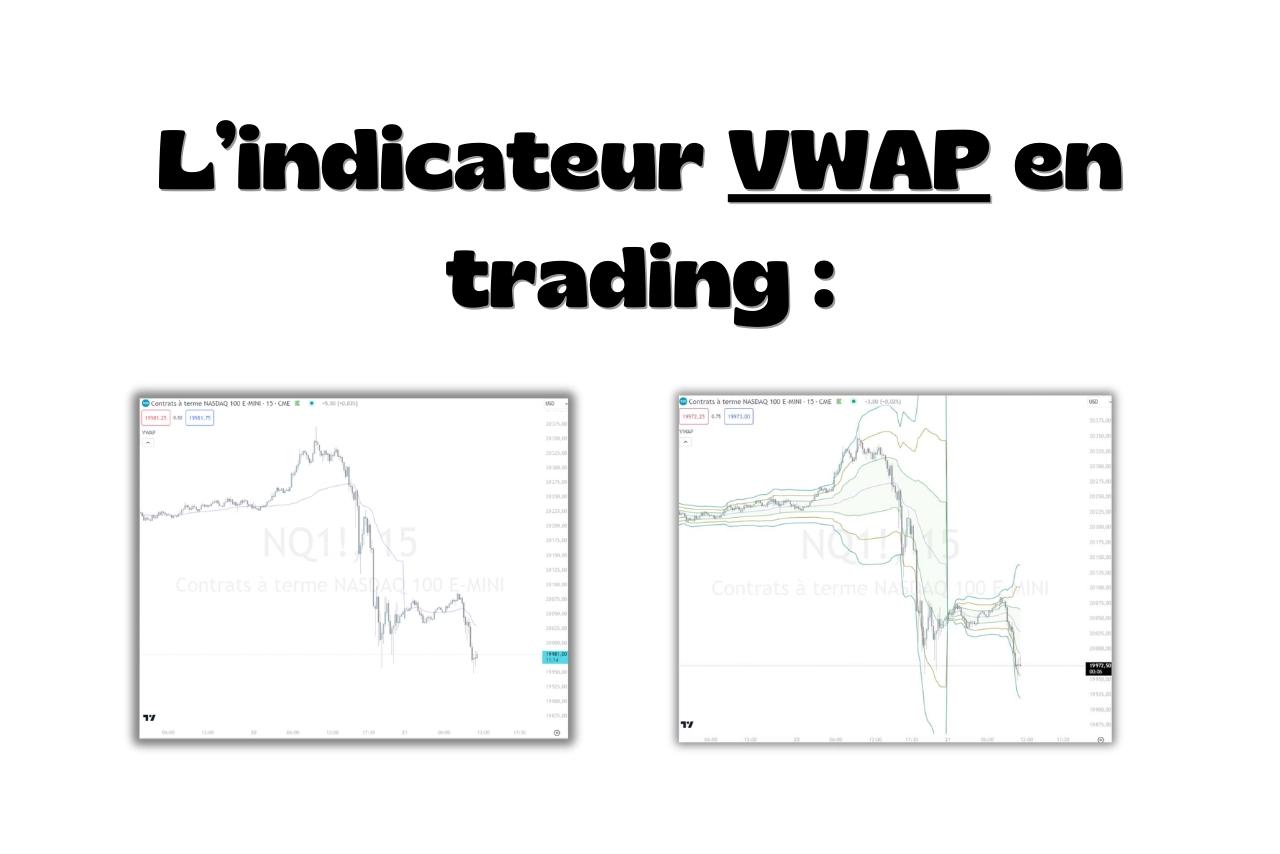
What is VWAP?
VWAP, or Volume Weighted Average Price, is a trading indicator that calculates the average transaction price over a given period, weighting each price by its traded volume.
The more volume traded at a price, the more weight that price carries in the VWAP calculation.
The calculation covers a reference period, generally a session, but it can also cover a week or a month.
VWAP = sum of volume-weighted prices / total volume
VWAP changes as new trades are recorded, then resets at the start of the next period.
Anchored VWAP
Anchored VWAP works like regular VWAP, but you choose its starting point directly on the chart.
Instead of automatically restarting at the beginning of a session, it can start from a specific candle.
You can then track the volume-weighted average price of trades since that point.
VWAP vs moving averages: what's the difference?
VWAP and a moving average both calculate an average, but they work differently.
A moving average uses a fixed number of candles.
With each new candle, the oldest drops out of the calculation and the newest is added.
VWAP stays tied to the chosen reference period.
A moving average changes with the chart timeframe, whereas VWAP gives a broadly consistent reading across timeframes.
Why is VWAP used in trading?
Measuring order execution quality
VWAP was first used to evaluate the price achieved when executing a large order.
When a fund needs to buy a large number of shares or contracts, it generally splits its order into several trades to limit its impact on price.
Once the order is filled, its average execution price can be compared with VWAP for that period:
- Buying below VWAP means the average price paid was below the market's volume-weighted average
- Buying above VWAP means execution took place at a higher average price
VWAP therefore acts as a benchmark for assessing execution quality.
A reference used by algorithms
Many execution algorithms use VWAP to distribute orders throughout the session.
They may aim for an average price close to VWAP while limiting their market impact.
That makes it a reference followed by many traders and explains its role in order flow analysis.
How reliable is VWAP?
VWAP's reliability depends on the quality of the volume data available for the market concerned.
Futures and stocks
VWAP is particularly suited to futures, where volume represents contracts actually traded on a centralised exchange.
It can also be used for stocks, although trades may be spread across several execution venues.
Forex and CFDs
In Forex and CFDs, a platform's displayed volume represents its own activity, not the combined activity of every platform.
VWAP can still be used as a reference, but the reading depends more heavily on the broker's data.
Cryptocurrencies
In crypto, volume represents real transactions, but those transactions are spread across many exchanges.
VWAP calculated on Binance can therefore differ from VWAP on Coinbase or another platform.
The market also runs continuously, making the choice of reset time more arbitrary than for futures or stocks.
Setting up VWAP on TradingView
Choosing the reference period
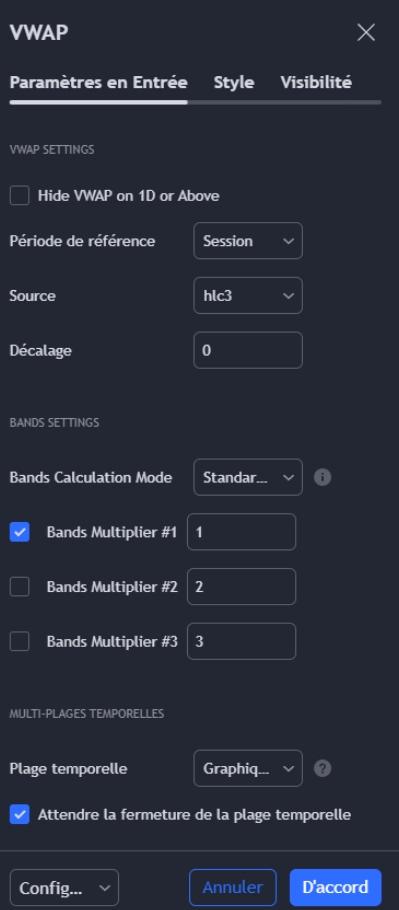
The main setting is in the "Inputs" tab.
It determines when the VWAP calculation resets.
I generally use "Session" for intraday analysis.
"Week" and "Month" let me use a longer period when I want a broader view.
Displaying standard-deviation bands
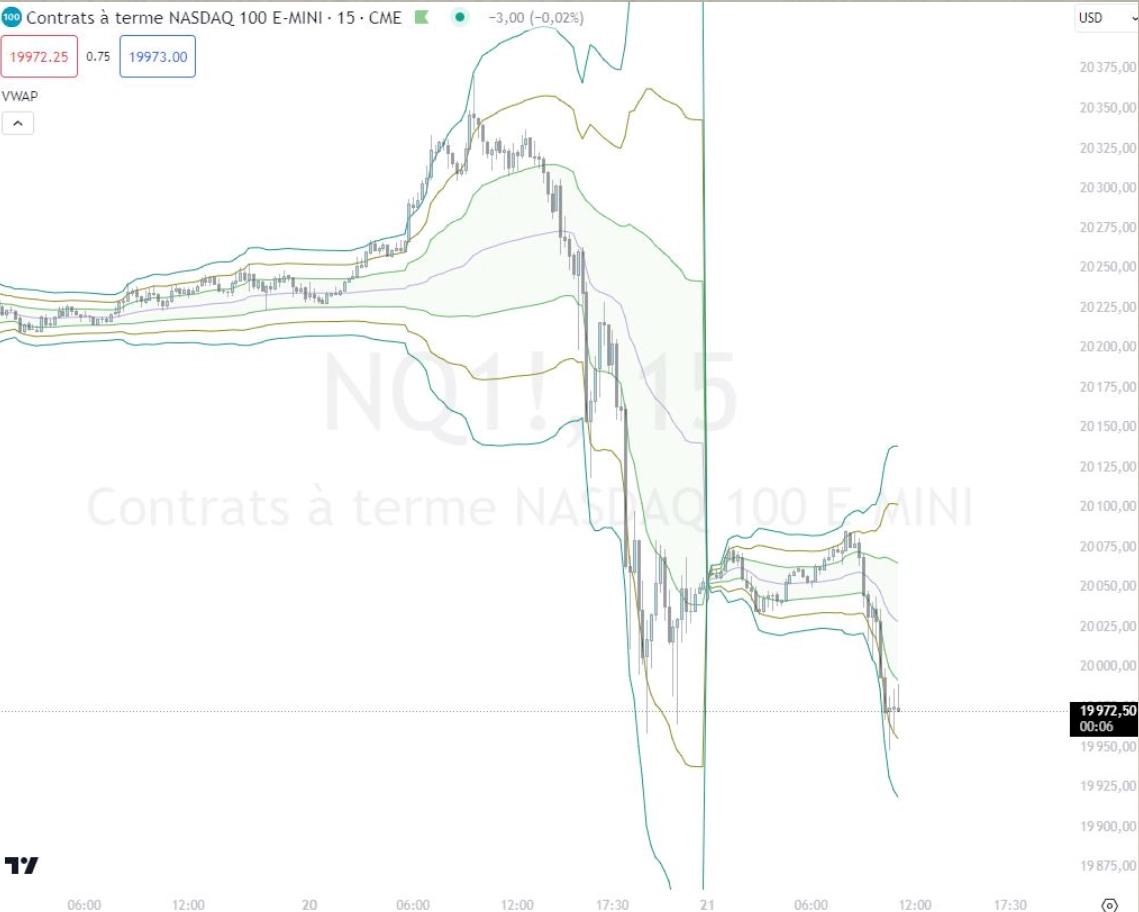
TradingView lets you add several bands around VWAP:
- 1 standard deviation
- 2 standard deviations
- 3 standard deviations
These bands measure how far price is from VWAP.
I mainly use the first two levels. That's enough for my reading while keeping the chart clear.
Adjusting the indicator's appearance
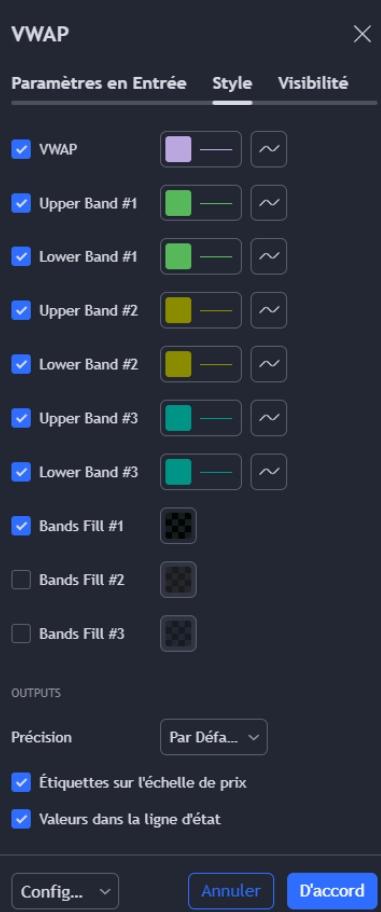
The "Style" tab lets you change the colour, thickness and line type of VWAP and its bands.
I use few colours and fill only the area between the first standard-deviation bands to keep the chart easy to read.
Adding Anchored VWAP
TradingView has a tool called "Anchored VWAP".
Select it, then click the candle you want to use as the starting point.
The line starts from that candle and updates as new data arrives.
Interpreting and using VWAP in trading
Where price sits relative to VWAP
- Below VWAP, price can be considered undervalued relative to the period's volume-weighted average
- Above VWAP, it can be considered overvalued relative to that same reference
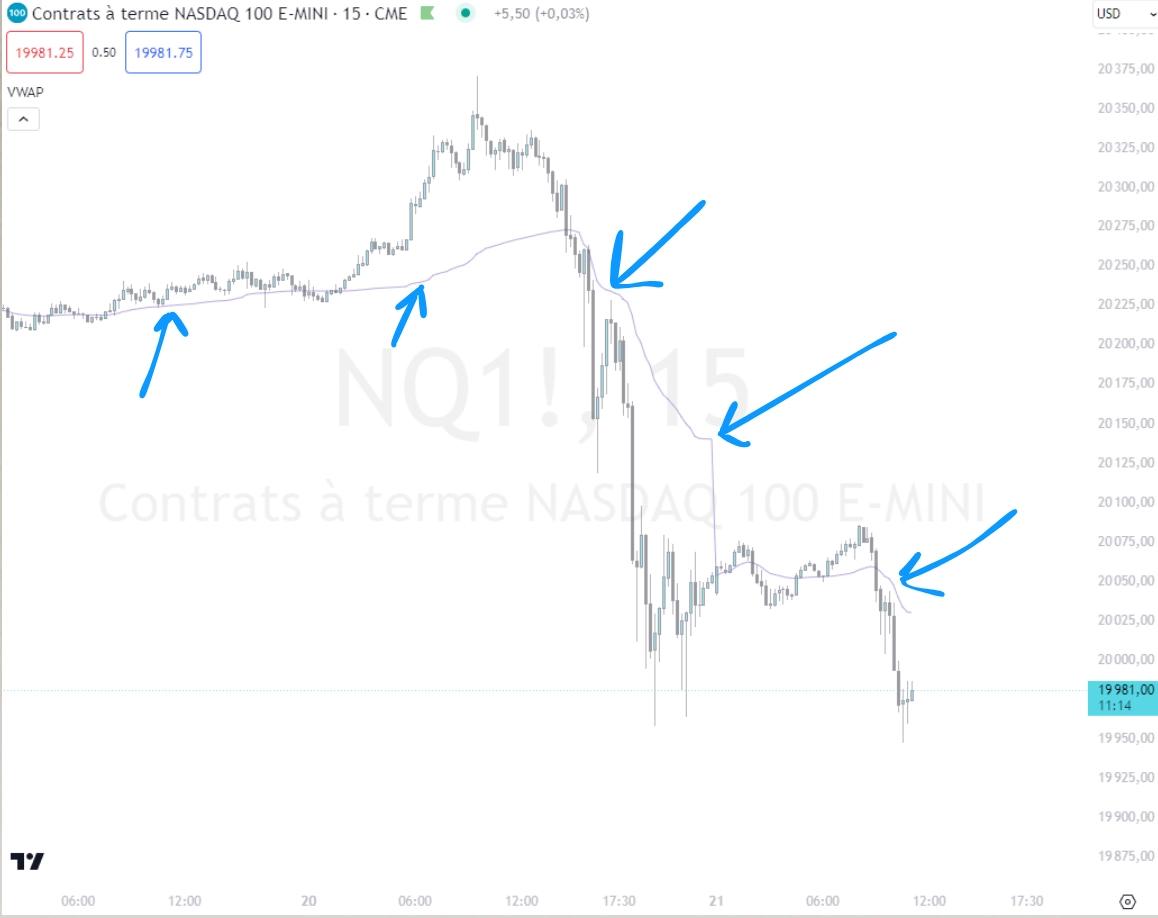
This reading is relative to VWAP only.
It doesn't mean the asset is fundamentally undervalued or overvalued, and it isn't a buy or sell signal on its own.
Volume Profile complements this reading by showing the price levels where volume concentrated.
I explain how to combine the tools in my article on using VWAP with Volume Profile.
Adding weekly VWAP to intraday analysis
I also use weekly VWAP alongside session VWAP.
It lets me quickly see whether the day's context agrees with the week's.
When price is on the same side of both VWAPs, the two periods give a consistent reading.
When price is between them, the context is more mixed, and I take that into account.
Calculating VWAP
Platforms calculate VWAP automatically, but doing it manually shows how volume affects the result.
Calculating from volume-weighted prices
The most direct method uses each transaction price and its corresponding volume.
VWAP = sum of (price × volume) / total volume
There are five steps:
- Record the prices and volumes traded during the period
- Multiply each price by its corresponding volume
- Add those products together
- Add the volumes together
- Divide the sum of the products by total volume
Take these trades in asset X:
| Asset X price | Traded volume | Price × traded volume |
|---|---|---|
| €9,000 | 20 | €180,000 |
| €8,500 | 15 | €127,500 |
| €7,200 | 13 | €93,600 |
| €8,800 | 13 | €114,400 |
| €9,900 | 6 | €59,400 |
| €5,000 | 2 | €10,000 |
| €11,000 | 2 | €22,000 |
The sum of prices multiplied by volume is €606,900, for a total volume of 71 units.
606,900 / 71 = €8,548
The resulting VWAP is €8,548.
Calculating from each period's typical price
Another method uses a representative price for each candle rather than every individual trade.
This typical price is the average of the high, low and closing price.
Typical price = (high + low + close) / 3
Each candle's typical price is then multiplied by its volume, using the same weighting principle.
| Periods | Period 1 | Period 2 | Period 3 |
|---|---|---|---|
| High | €105 | €110 | €115 |
| Low | €95 | €100 | €105 |
| Close | €100 | €105 | €110 |
| Traded volume | 500 | 600 | 400 |
| Typical price | €100 | €105 | €110 |
| Volume × typical price | 50,000 | 63,000 | 44,000 |
The sum of weighted values is 157,000, for a total volume of 1,500.
157,000 / 1,500 = €104.67
The resulting VWAP is €104.67.
