
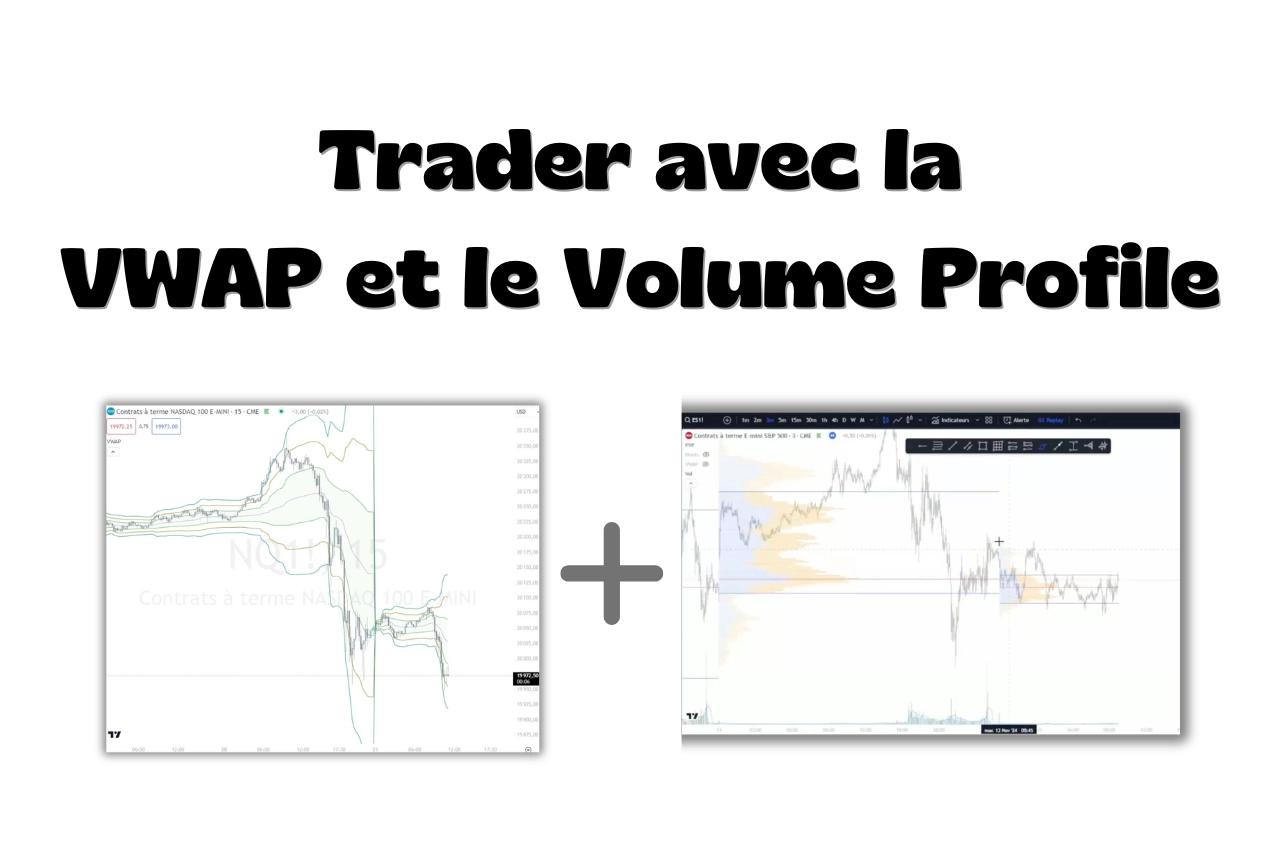
Volume Profile and VWAP offer two complementary views of the market.
I use them together to see whether trading remains concentrated around the same prices or is moving into new areas.
This approach relies on balance and imbalance, the concepts that give these two indicators their meaning.
Balance and imbalance
Balance and imbalance describe how trading activity is distributed around prices the market accepts.
Balance
A market is balanced when trading concentrates around a price area accepted by both buyers and sellers.
Volume concentrates around certain levels and generally decreases as price moves away from them.
The market can remain in this state for several sessions as long as participants keep accepting the same price areas.
Imbalance
A market is imbalanced when trading moves outside the previously accepted price area.
Price then moves towards new levels where trading can concentrate again.
That movement can last a few minutes or several sessions.
Balance, imbalance, ranges and trends
A range or trend describes how price moves on the chart.
Order flow analysis adds another perspective by examining the volume and trades accompanying that movement.
A market can move sideways while its volume areas gradually shift.
Conversely, a directional move can go through phases where trading remains concentrated around the same levels.
Volume Profile and VWAP let me observe that distribution and determine whether the market remains balanced or is starting to move into a new area.
Reading the context with Volume Profile
I use Volume Profile to see where volume concentrates and how those areas evolve from one session to the next.
I mainly look at two things.
The shape of the distribution
In a balanced market, volume distribution is generally regular, with trading concentrated around a central area.
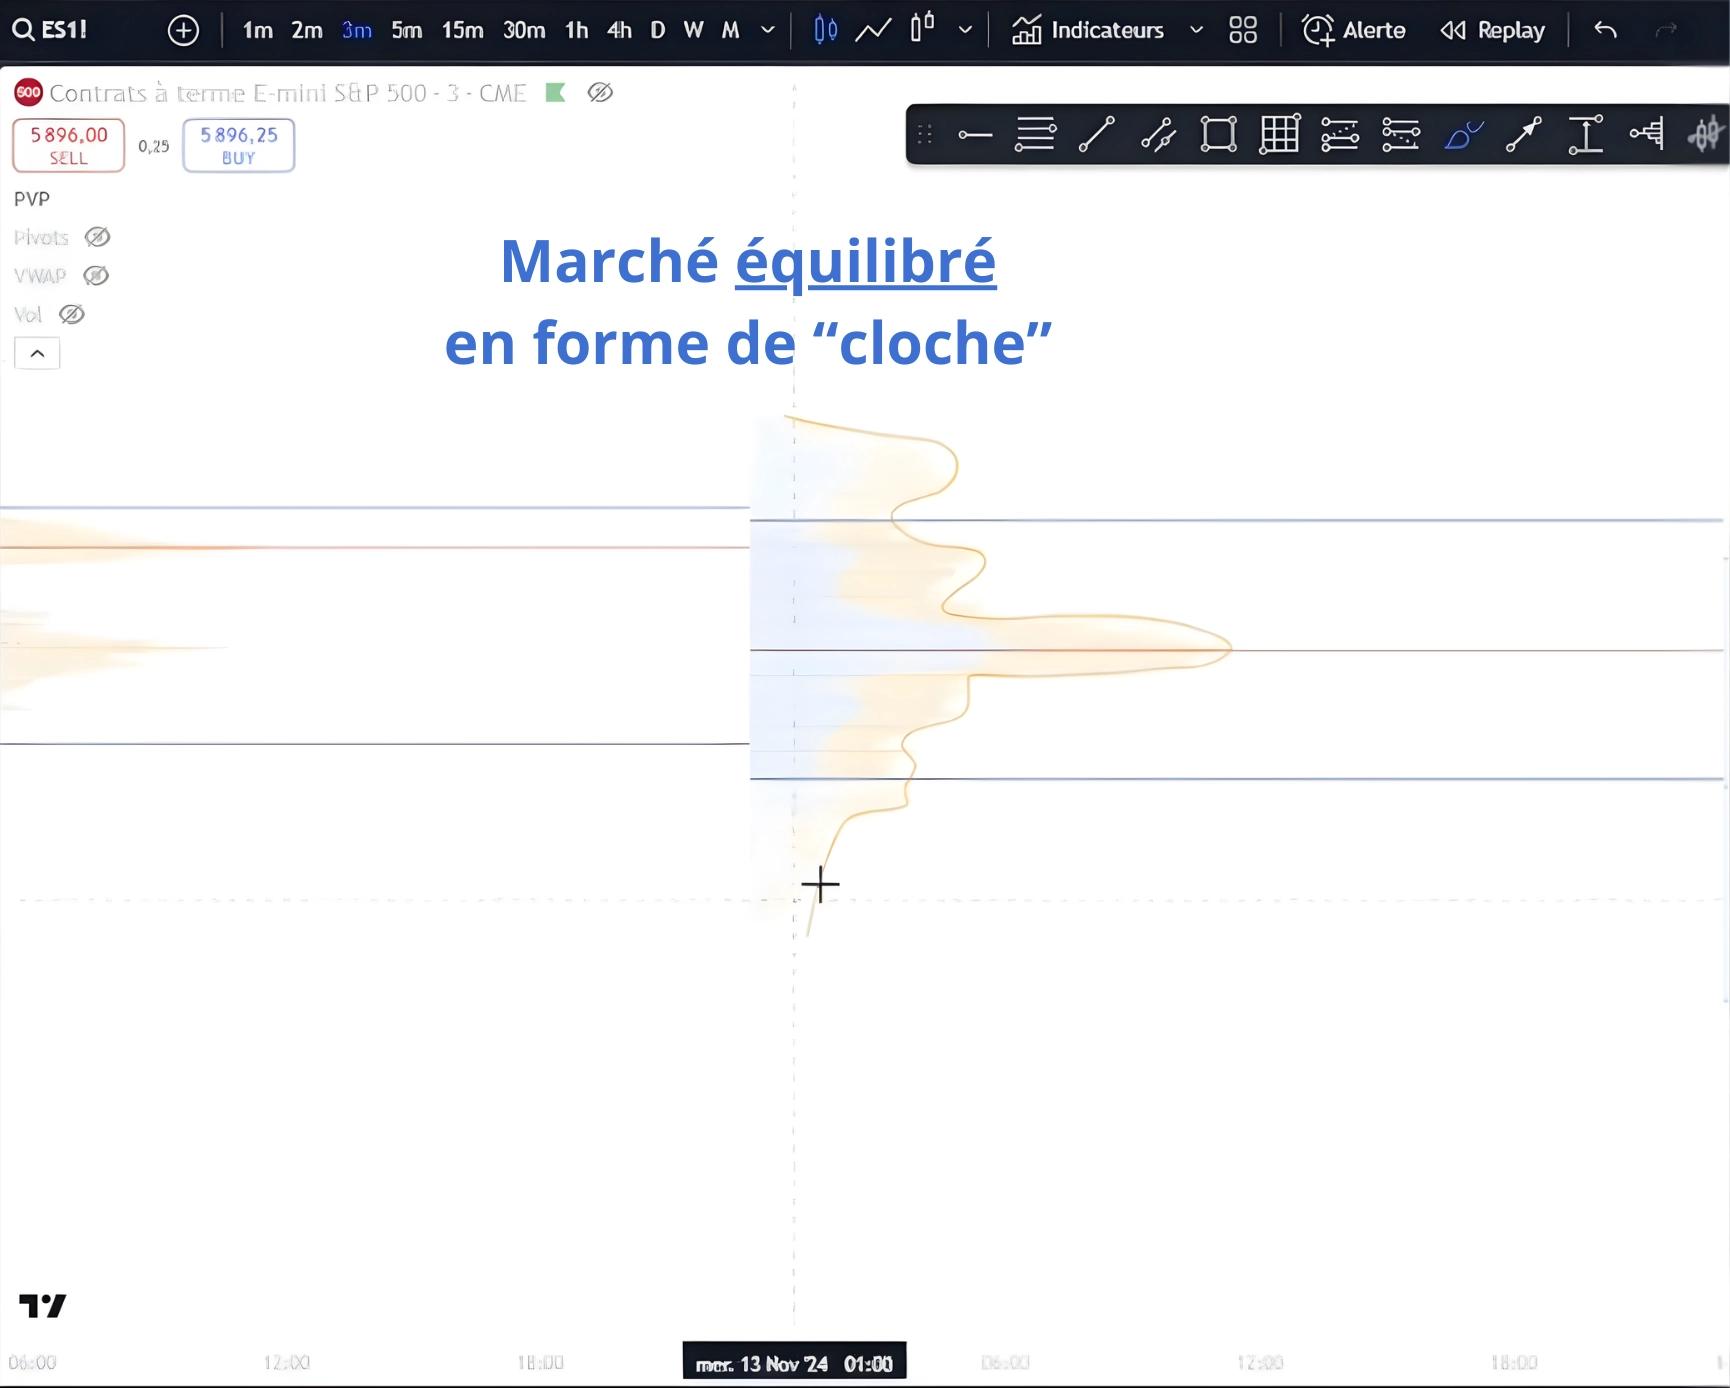
When the market moves towards new prices, the distribution often becomes more irregular, with volume concentrated in particular areas.
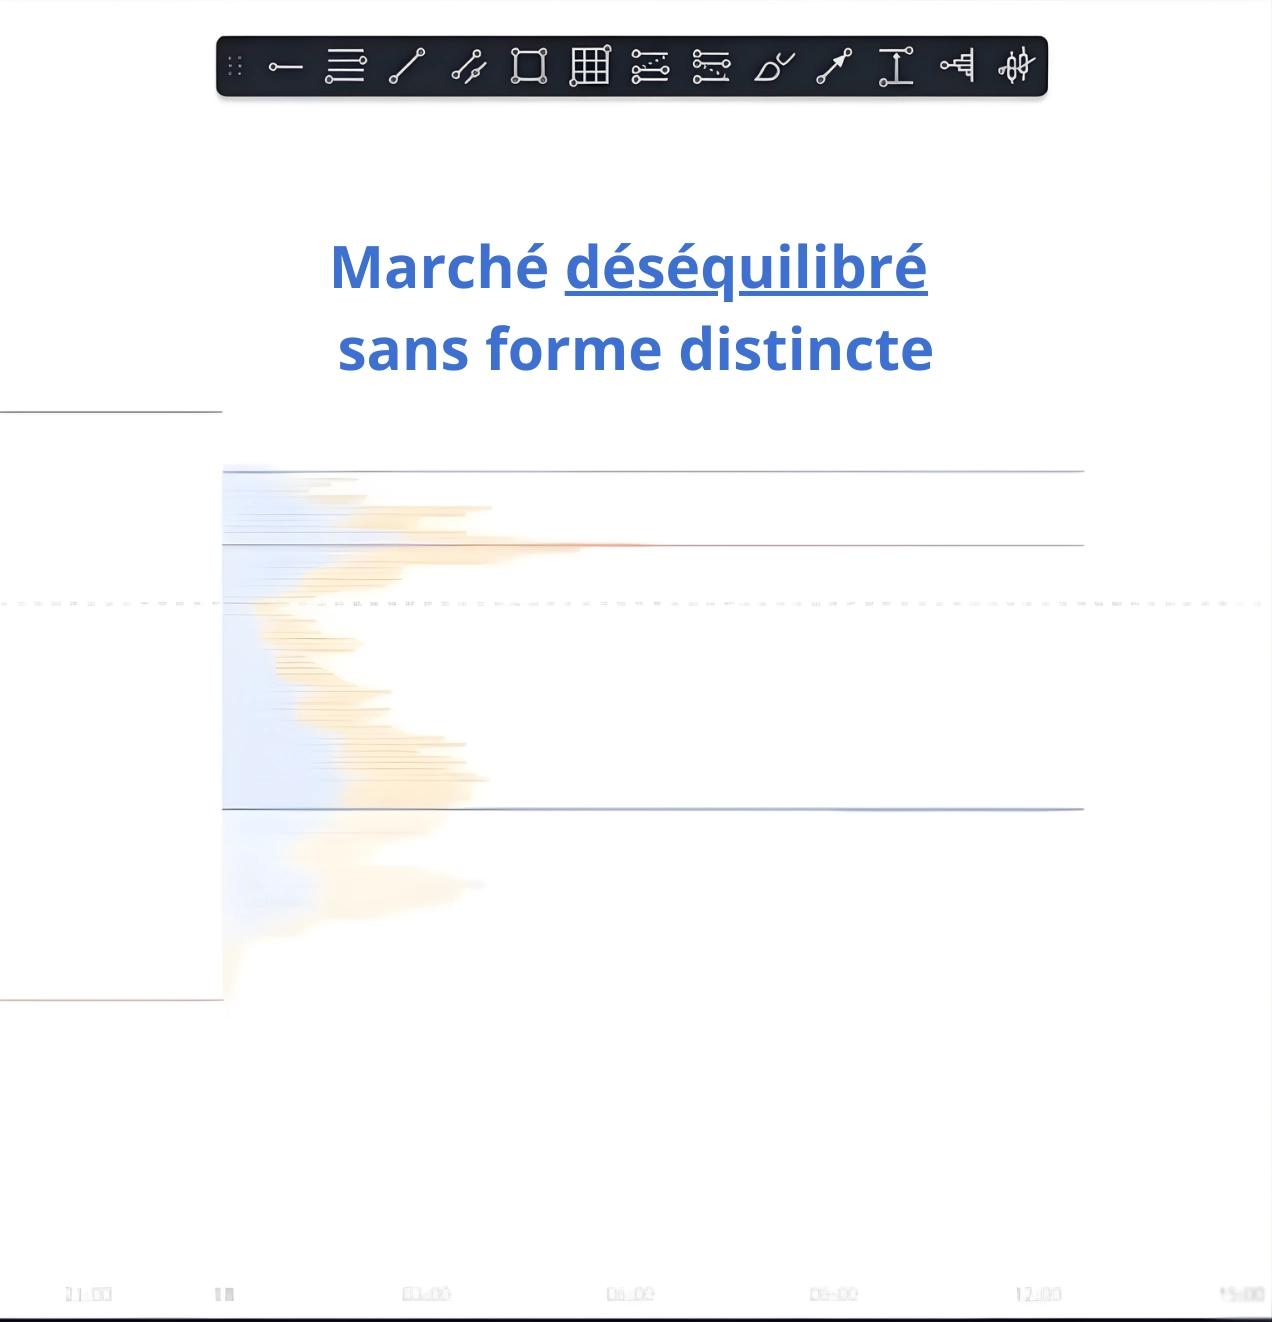
Above all, I want to know whether trading remains organised around a stable area or is starting to shift.
Shifting value areas
I also compare today's Value Area with those of previous sessions.
When several value areas overlap heavily, trading continues to concentrate around the same prices.
I call this the "Russian dolls" setup.
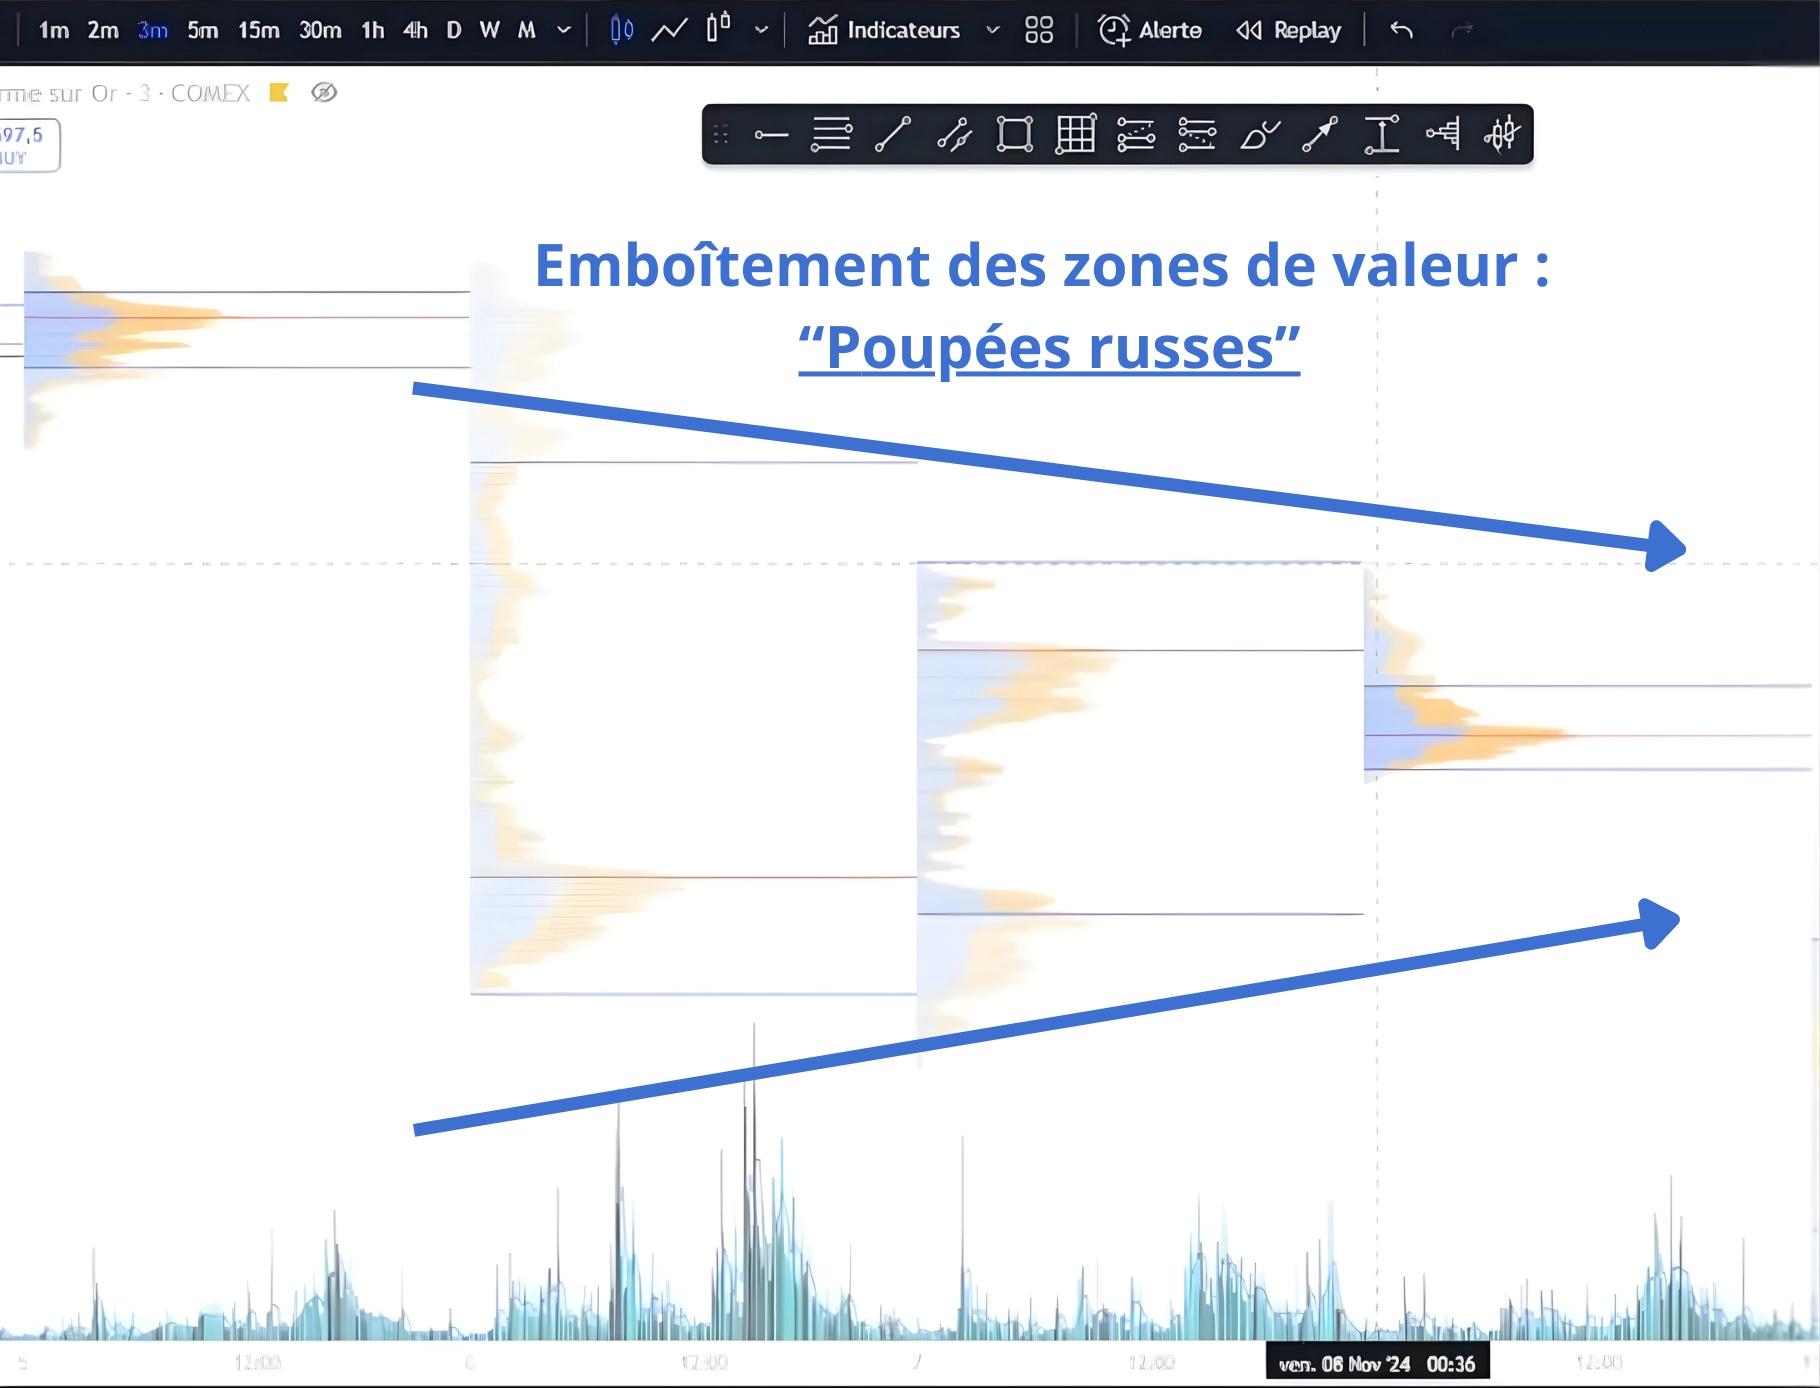
When value areas gradually shift higher or lower, the market is instead starting to accept new price levels.
This helps me establish the context before looking at how price behaves around VWAP.
Following the session with VWAP
VWAP helps me track where price sits during the session.
I mainly watch whether price stays close to VWAP or moves away from it.
That complements the context provided by Volume Profile.
For example, trading may have concentrated in the same areas for several days, while price starts moving away from VWAP during the current session.
Volume Profile gives me a broader context, while VWAP helps me follow what is happening over the shorter term.
How to combine VWAP and Volume Profile
The two readings become especially useful when they agree.
Trading a balanced market
In a balanced market, I mainly look for returns towards the areas where trading continues to concentrate.
The POC, high-volume areas and VWAP can provide references for prices the market regularly accepts.
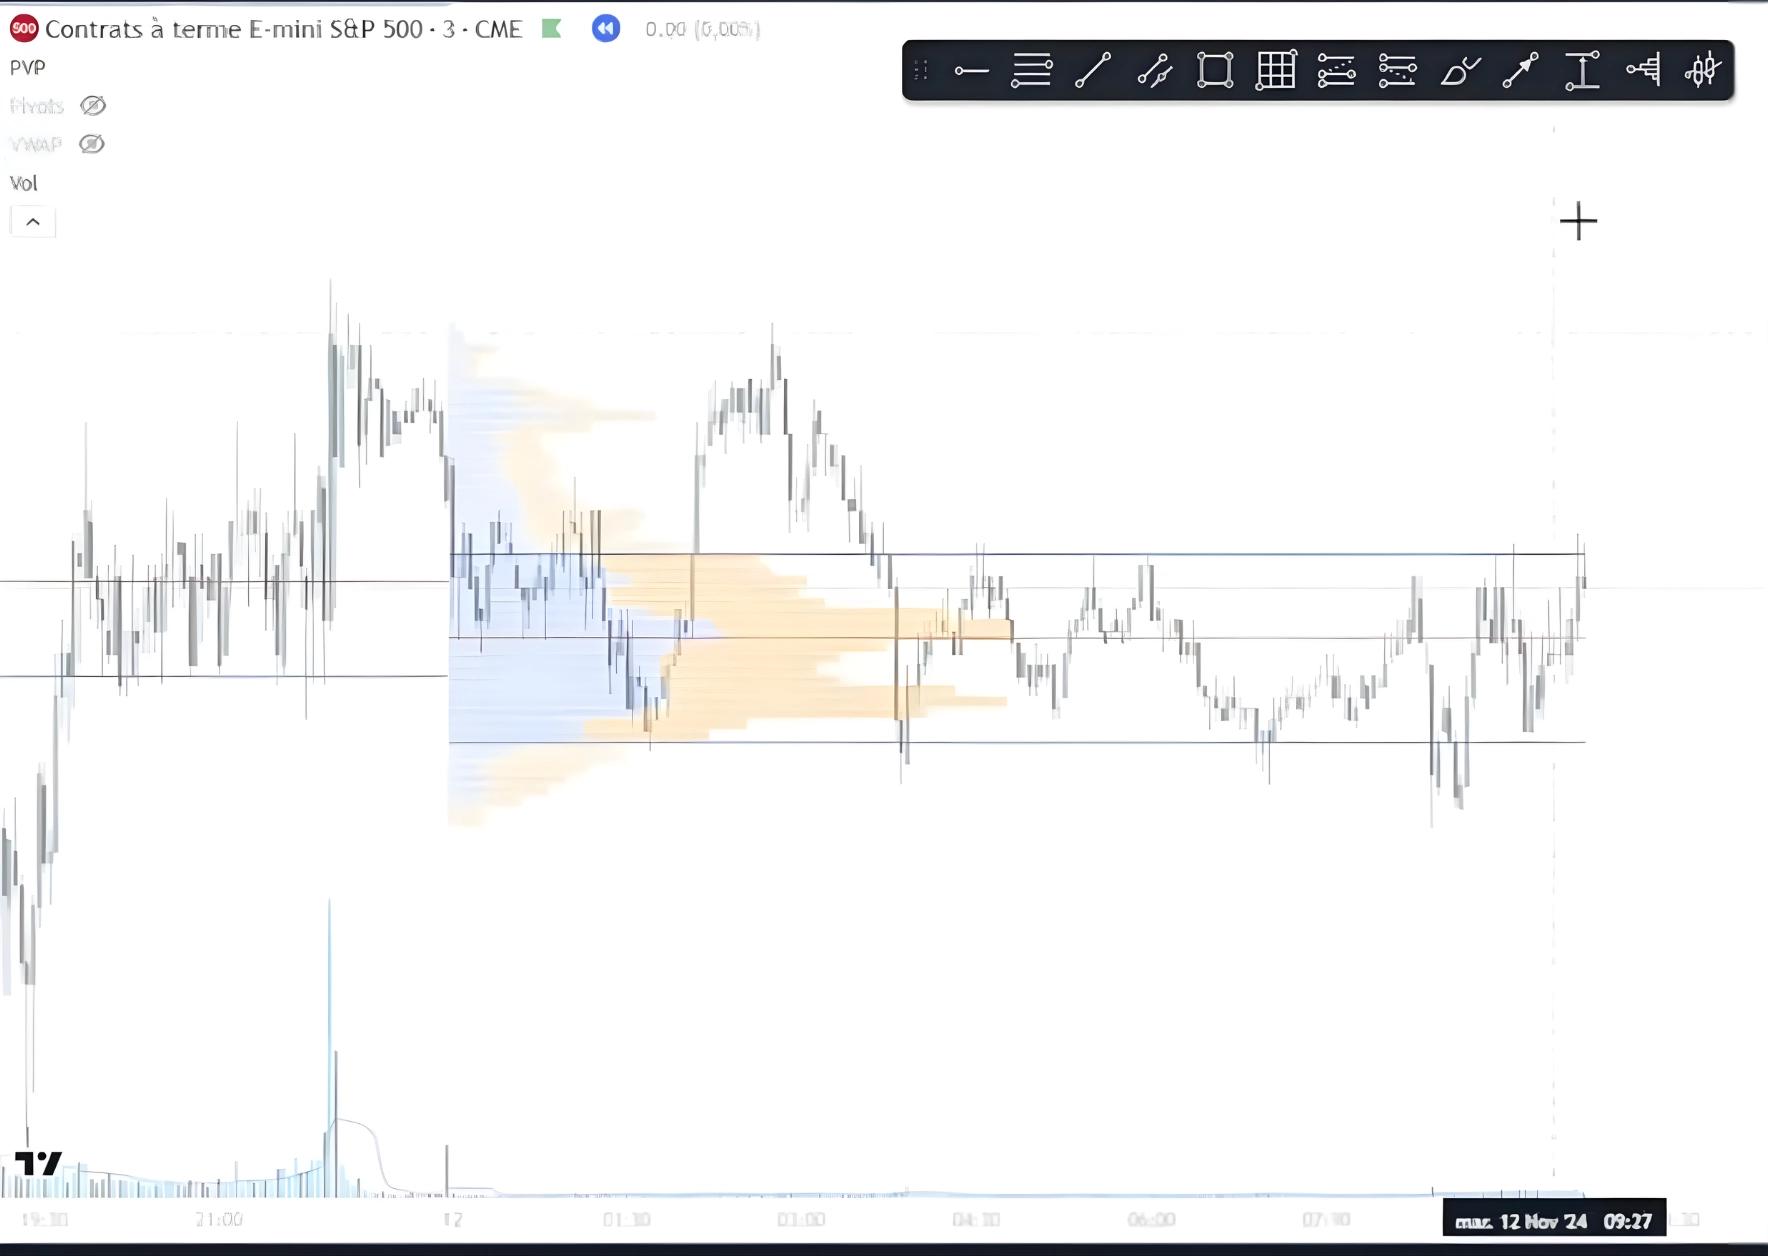
When price moves away from that area without a change in the broader context, I watch for a return towards previously accepted levels.
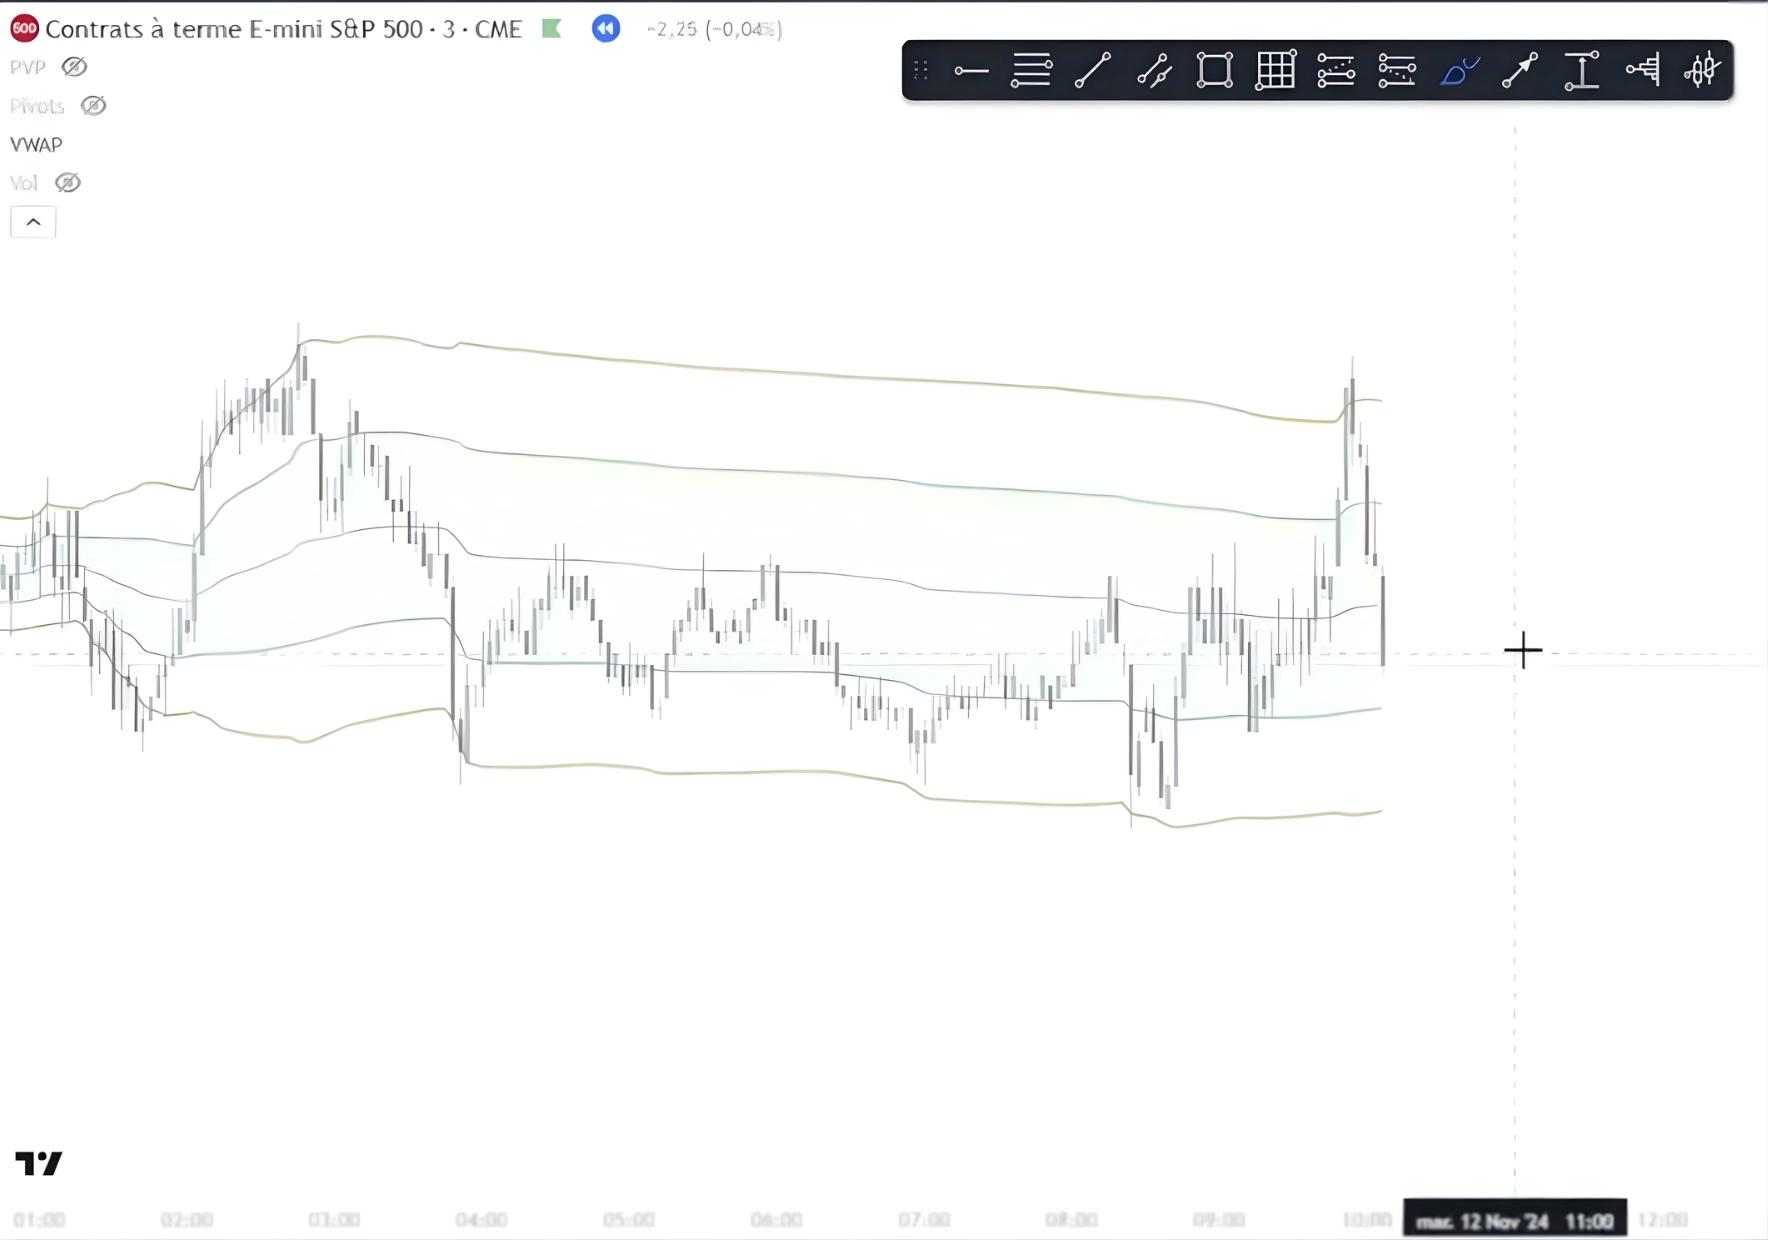
I don't take a position just because price is far from VWAP or the POC.
I also look at how price and volume react around those levels.
Trading an imbalanced market
In an imbalanced market, I look to trade in the direction the volume areas are moving.
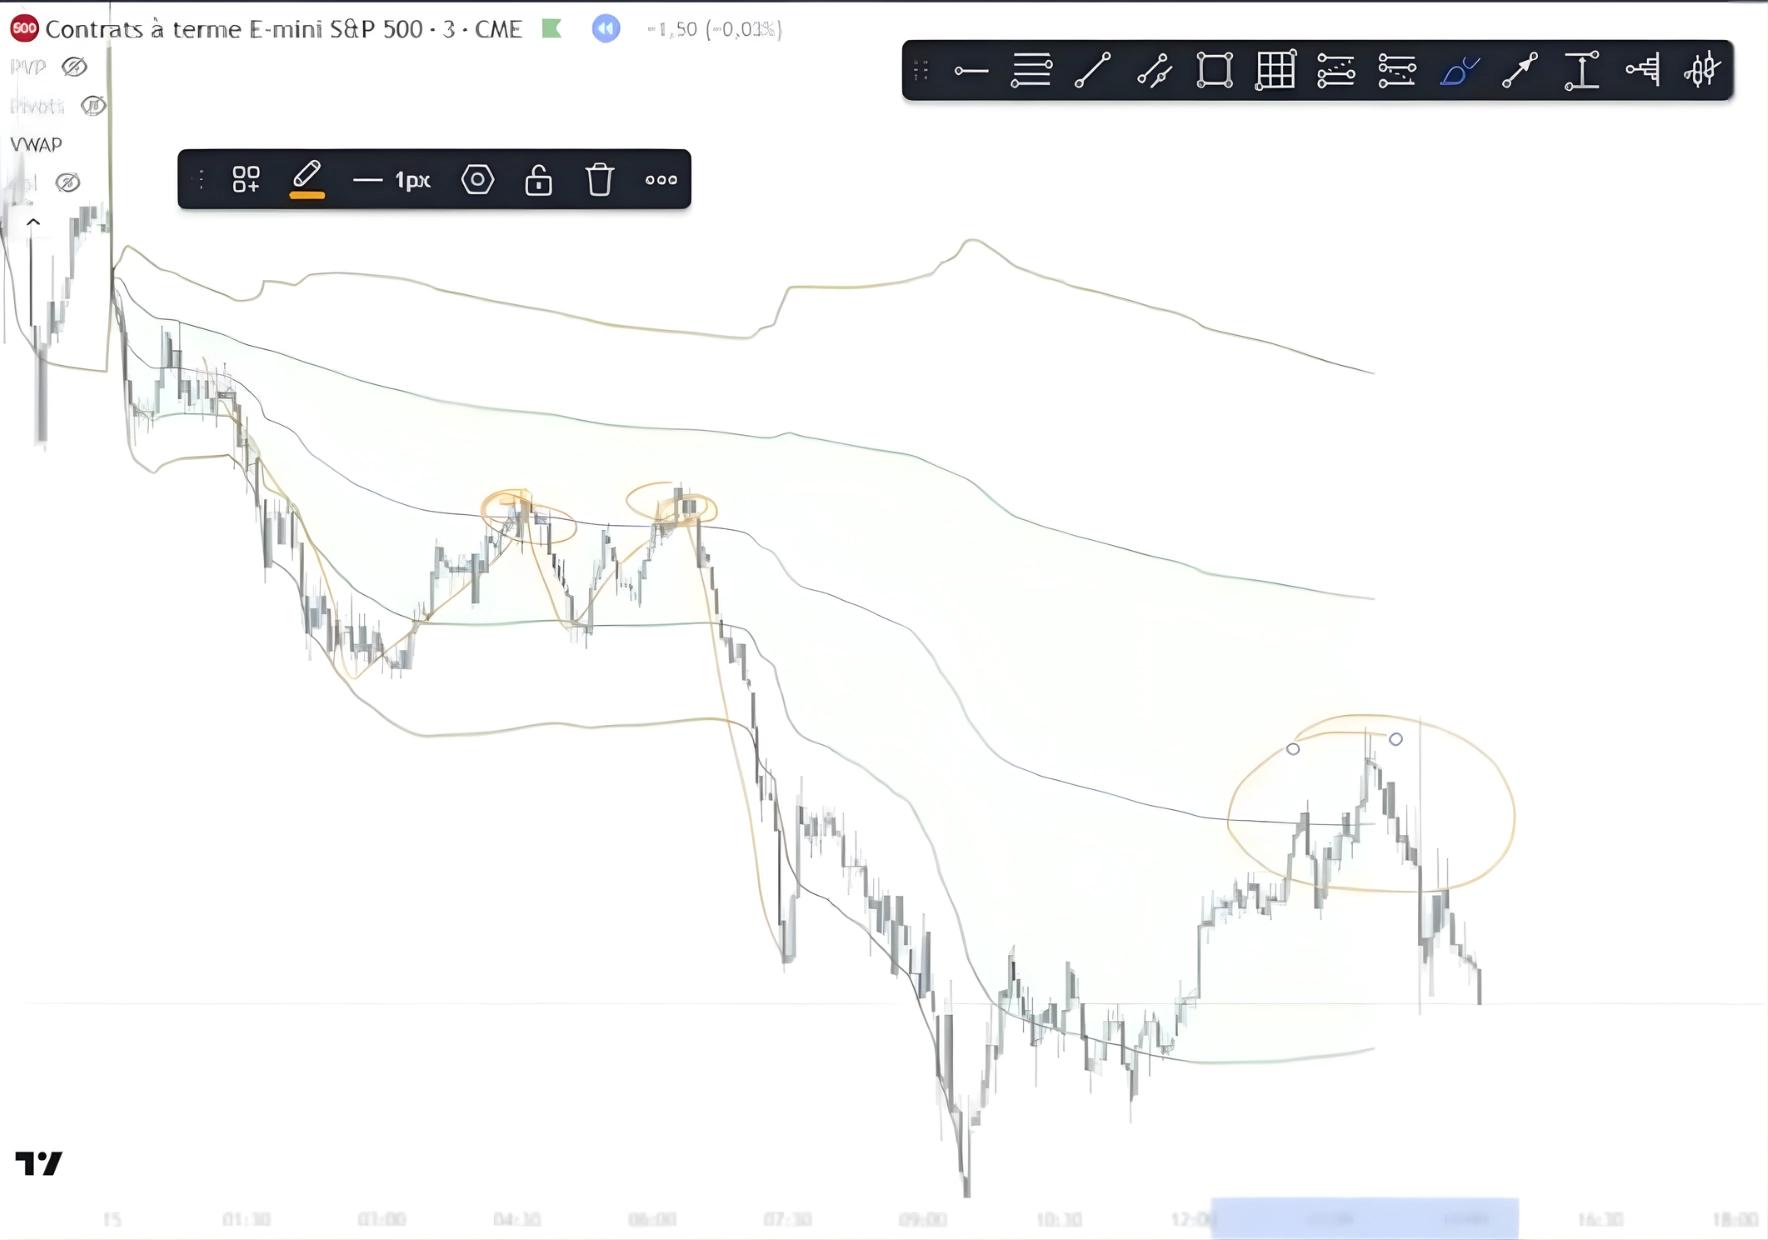
Take a market that's moving lower.
Value areas move down from one session to the next and no longer overlap in the same way as during the balanced phase.
If price then returns to VWAP without changing that context, I can look for a selling opportunity in the direction of the move.
A return to VWAP isn't enough to enter a position.
I also check the price reaction and volume to see whether sellers are stepping in again.
VWAP and Volume Profile provide context.
They don't replace a strategy's entry criteria or risk management.
When VWAP and Volume Profile disagree
The two indicators can sometimes give different readings because they don't describe exactly the same thing.
Volume Profile may show several sessions organised around the same areas, while price moves sharply away from VWAP for a few hours.
The reverse can happen too.
Value areas may gradually shift while price keeps returning to VWAP during the session.
I don't try to decide which indicator is right.
Volume Profile provides broader context on the distribution of trading, while VWAP helps track what happens during the session.
When the two readings don't agree, I give the scenario less weight and wait for more confirmation before taking a position.
