
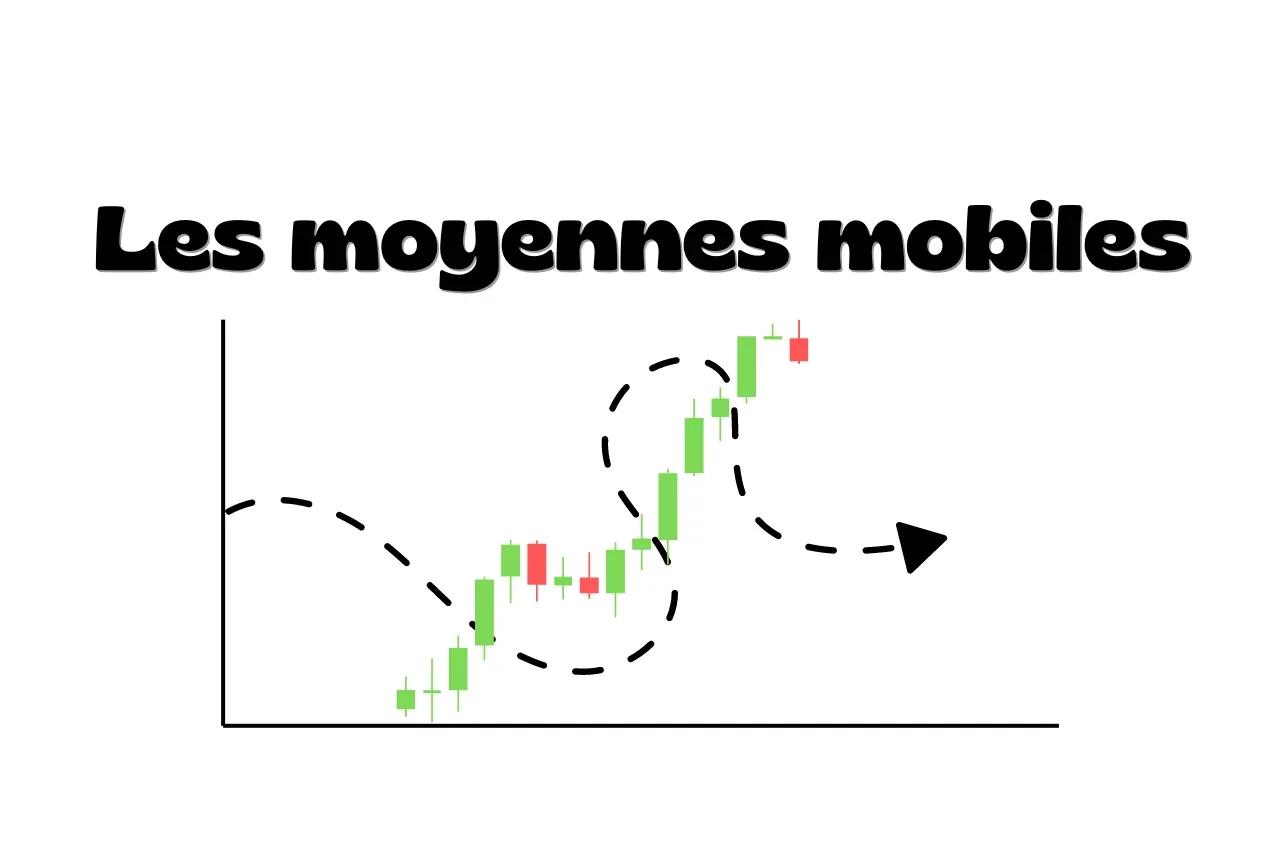
What is a moving average?
A moving average is the average price over a given period.
We call it a "moving" average because it's recalculated with every new candle.
The calculation updates by adding the newest price and removing the oldest.
For example, a 20-period moving average calculates the average of the last 20 closing prices.
How to calculate a moving average
The calculation is simple:
- Choose the number of periods, for example 20
- Take the last X closing prices, where X is the number of periods
- Add those prices together
- Divide the result by the number of periods
Here's an example with a 5-period moving average:
- Closing prices of the last 5 candles: 100, 102, 99, 101, 103
- Sum: 100 + 102 + 99 + 101 + 103 = 505
- Average: 505 / 5 = 101
The moving average value for this candle will be 101.
Different types of moving averages
There are several types of moving averages.
The most common are:
- Simple moving average (SMA): the one I've just explained
- Exponential moving average (EMA): gives more weight to recent prices
How to use moving averages in trading
1. Identify the trend
One of the most common uses of moving averages is identifying the trend.
Here's what to do:
- Choose a long-term moving average, for example 100 periods
- If price is above the moving average, the trend is bullish
- If price is below it, the trend is bearish
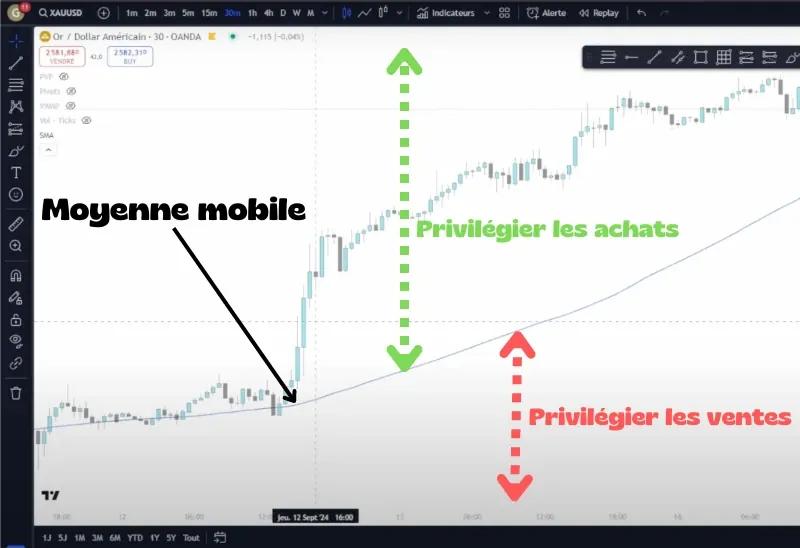
For example, on a 30-minute gold chart (XAU/USD):
- Price is above the MA100: you favour buying, shown by the green arrow
- Price moves below the MA100: you consider selling, shown by the red arrow
2. Moving average crossovers
Another strategy uses the crossover of two moving averages:
- Choose a short-term moving average, for example 20 periods
- Choose a long-term moving average, for example 200 periods
- Wait for the two moving averages to cross
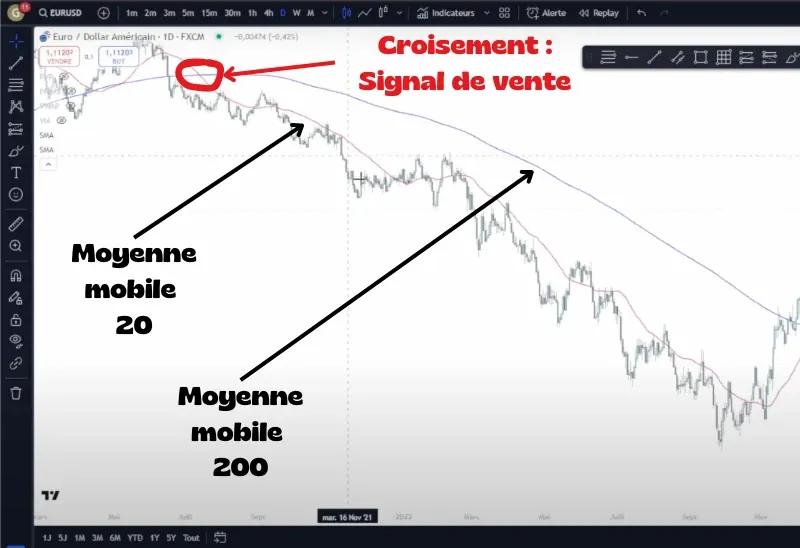
Here's how you could interpret the signals:
- The MA20 crosses above the MA200: buy signal
- The MA20 crosses below the MA200: sell signal
This is a strategy for spotting trend changes on higher timeframes.
3. Dynamic support and resistance
Moving averages can also act as dynamic support and resistance levels:
- Choose a moving average suited to your timeframe, for example the MA20
- Watch how price reacts when it touches the moving average
- Use these levels to look for entries in the direction of the trend
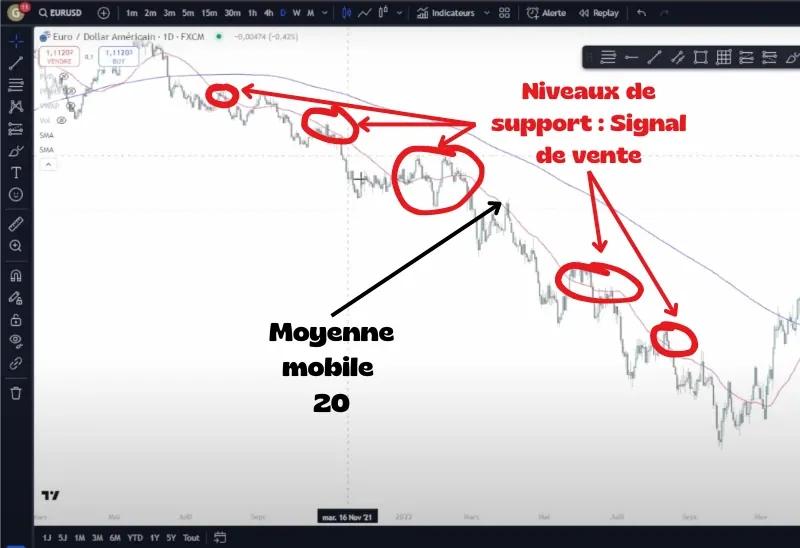
For example:
- Price rises towards the MA20
- It bounces off the moving average, indicating dynamic resistance
- You can consider selling each time price touches the MA20 and bounces downwards
- You can place a stop loss just above the moving average to protect against a reversal
The limits of moving averages
Moving averages are very popular, but they have their limits:
Moving averages are lagging indicators. They're based on past data, which can produce late signals.
- They work better in trending markets
- They produce plenty of false signals in ranging markets
- Like all indicators, they aren't foolproof
