
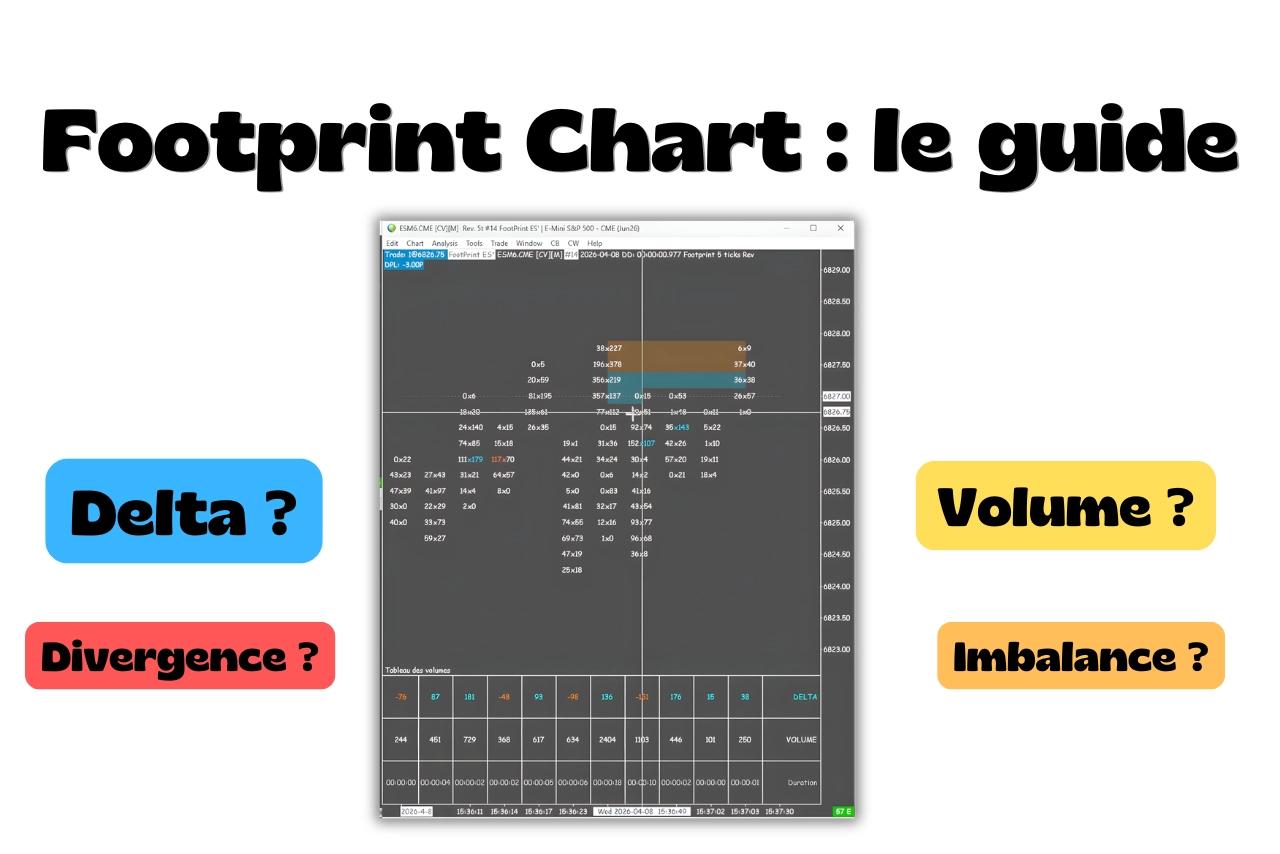
A footprint chart is a trading tool that shows buying and selling volume at each price level within every candle.
A candlestick chart shows where price went. A footprint shows how it got there.
It's one of the central tools in order flow trading.
How to read a footprint chart
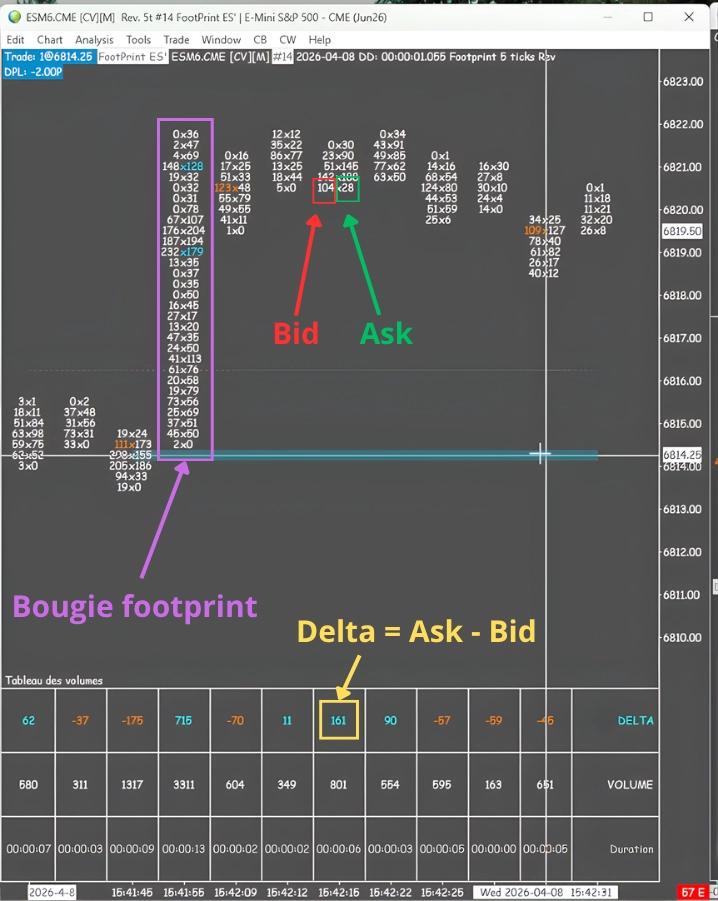
Each candle is broken down into volume blocks at each price level, also called clusters.
Each volume block corresponds to a price level and shows two numbers:
- Volume traded on the sell side, at the bid, on the left
- Volume traded on the buy side, at the ask, on the right
I also use three other elements:
- Delta: the difference between ask volume and bid volume at each price level
- Total volume: combined volume at each price level, without separating bid and ask
- Duration: how long the candle took to form
Depending on your trading platform, you can configure and change the data displayed in the footprint.
How to interpret a footprint
Delta and delta divergence
A candle's delta is the difference between aggressively bought volume at the ask and aggressively sold volume at the bid across the entire candle.
An aggressive order simply means entering with a market order, at the first available price.
Positive delta indicates aggressive buyers dominated that candle.
Negative delta indicates the opposite.
Delta divergence happens when delta and price move in opposite directions.
For example, price closes higher but delta is negative.
That means price rose despite a majority of aggressive selling, which often points to an imminent reversal.
Imbalances and stacked imbalances
An imbalance appears when volume on one side significantly exceeds the other at a specific price level.
The threshold can be configured according to the platform and each trader's preferences.
When several imbalances in the same direction appear vertically one after another within a candle, they're called stacked imbalances.
They indicate strong, sustained directional pressure across several consecutive price levels.
Iceberg orders
Sometimes a candle rises even though its delta is negative.
That means there are more aggressive sellers than aggressive buyers, yet price still rises.
One explanation is that buyers have placed large limit orders in the order book.
These orders absorb aggressive sellers tick by tick, without appearing in delta.
Price rises because of that passive liquidity, not because of market buy orders.
When this happens across several consecutive levels, we talk about an iceberg order: a participant continually replenishes limit orders to block further declines.
Locating volume within a candle
Overall delta tells you whether buyers or sellers dominated a candle, but not at which price level that dominance occurred.
By looking at individual volume blocks, you can identify where the bid/ask difference was greatest.
Those are the precise levels where pressure was most concentrated, helping you refine an entry.
It takes practice, but eventually you can see at a glance where volume concentrated within a candle.
The three types of footprint confirmation
When price reaches a level, footprint signals can reveal three types of setup.
Strong confirmation
Price reaches a key level, such as VWAP, support or resistance.
You see a reversal candle with a large delta in the expected direction, higher volume than previous candles and a short duration.
Together, these three elements show that one side took control quickly and forcefully.
Absorption confirmation
Price reaches a level with sustained aggressive selling, but doesn't fall.
Delta is negative, yet price doesn't move.
That indicates limit-order buyers in the book are absorbing each market sell order.
Sellers can't push price down because there is buy liquidity on the other side.
To exit their positions, they'll have to buy, creating additional demand.
Exhaustion confirmation
Price falls on low overall volume and slightly negative delta.
It isn't seller strength pushing price lower. It's the absence of buyers.
Even a small market sell order is enough to move price down.
This signal generally produces a slow move that needs a broader context before you can trade it.
How to use a footprint in trading
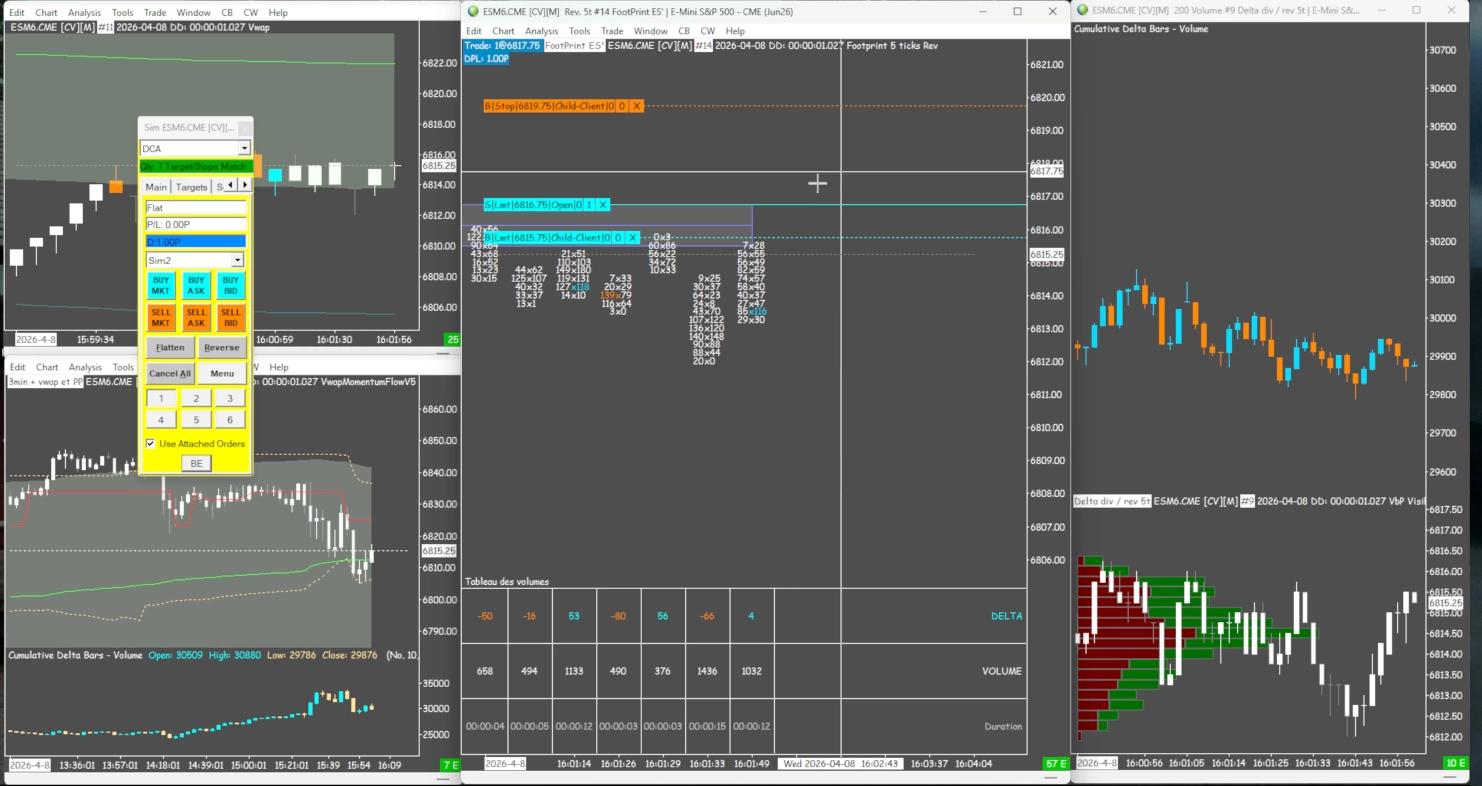
Markets and platforms
Footprints work best where tick-by-tick bid/ask data is available: futures, including indices, commodities and interest rates, and liquid cryptocurrencies.
In spot Forex, this data isn't available in the same way.
Commonly used platforms include Sierra Chart, ATAS, Bookmap and TradingView.
Confirming or invalidating an entry
I use the footprint alongside other tools to confirm or invalidate my entries:
- A Volume Profile level
- An algorithmic level such as VWAP
- A technical level
CVD, or Cumulative Volume Delta also helps strengthen this reading:
- When CVD and price move in the same direction, footprint signals are reliable
- When they diverge, delta alone isn't enough to guide a decision
The absence of confirmation is information in itself.
It can help you avoid a trade just as much as it can help you take one.
Refining your entry
Once price is at a level, two factors influence where you place your entry.
The first is the confirmation itself: strong, absorption or exhaustion.
The second is how quickly price moves.
A market can have a wide range but move slowly on the footprint.
Another can have a narrow range but form candles in one or two seconds.
In a fast market, you can place your entry a few ticks below the level to avoid getting caught in the noise.
In a slow market, you can enter closer to it.
The limits of footprint charts
A footprint displays a lot of information at once.
Trying to read everything spreads your attention too thin and slows decision-making.
It's better to master two or three specific setups before taking it further.
Too many colours and visual indicators make that problem worse.
A clean footprint, showing only imbalances, lets you focus on the numbers rather than the colours.
