
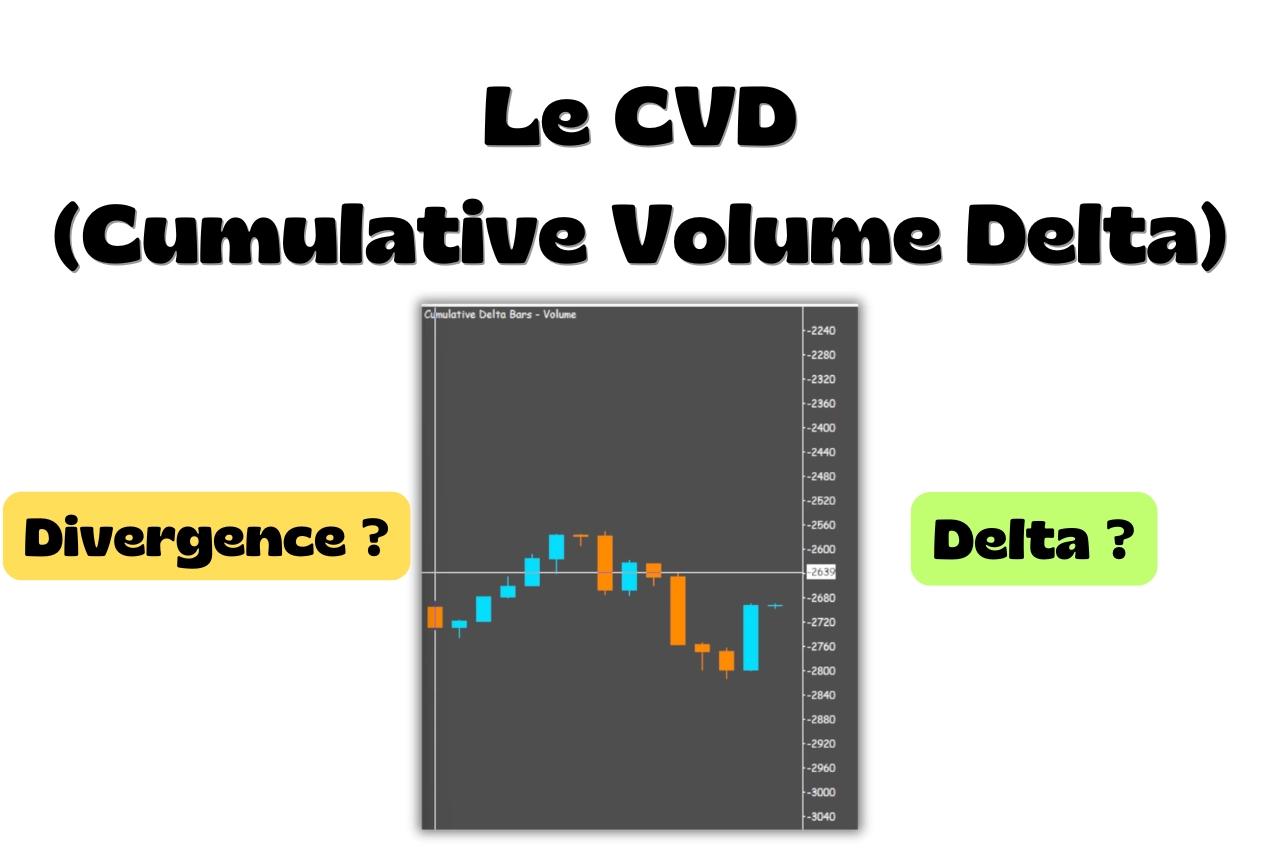
Cumulative Volume Delta (CVD) is an order flow indicator that adds up each candle's delta from the start of the session.
Delta measures the difference between aggressive buying, orders executed at the ask, and aggressive selling, orders executed at the bid, within a candle.
CVD continuously adds those deltas together. Delta tells you who dominated one particular candle; CVD tells you who has dominated since the session began.
Calculating CVD
CVD adds up each candle's delta from the start of the session:
CVD(n) = CVD(n-1) + delta of candle n
For example:
CVD starts at 0 at the open.
If the first candle has a delta of +500 contracts, CVD is +500.
If the next candle has a delta of -200, CVD moves to +300.
It isn't a snapshot of the current candle. It's the running total of everything that's happened since the open.
How to read CVD on a chart
CVD appears as a line or histogram below the price chart.
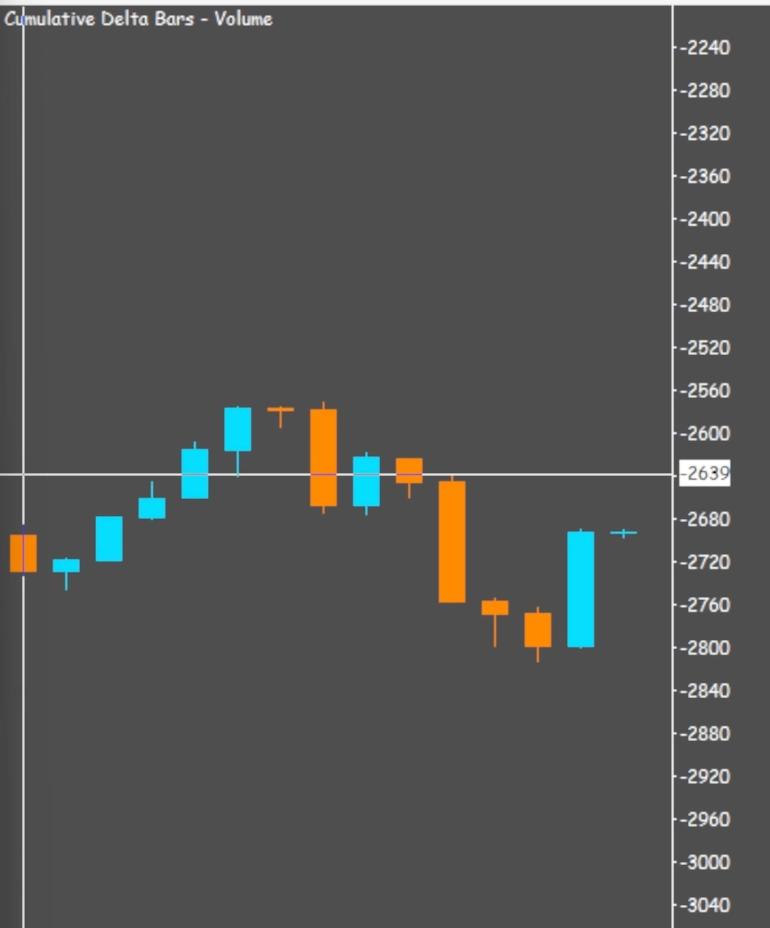
Rising CVD: aggressive buyers have dominated since the open. Cumulatively, more volume has traded at the ask than at the bid.
Falling CVD: aggressive sellers dominate. Selling flow has exceeded buying flow since the open.
What matters when reading CVD is its relationship with price, not its absolute value.
A CVD of +4,000 tells you nothing without knowing what price is doing alongside it.
CVD and price divergences
A divergence appears when CVD and price move in opposite directions.
Bearish divergence
Price makes a new high, but CVD makes a lower high.
That suggests fewer aggressive buyers are pushing price to the new level.
The latest upward move has less conviction behind it, often indicating that the trend is fragile at that point.
Bullish divergence
Price makes a new low, but CVD makes a higher low.
That suggests aggressive sellers are losing strength: new price declines are no longer backed by the same selling flow.
A divergence isn't a trade trigger on its own. It tells you the current trend may be fragile.
I combine it with a Volume Profile level, a VWAP or a footprint reading to confirm or invalidate my scenario.
Detecting absorption with CVD
Sometimes CVD rises sharply, but price goes nowhere.
There's a lot of aggressive buying, yet price remains stuck.
That can indicate limit-order sellers absorbing each wave of buying. Price doesn't rise because passive sell liquidity keeps replenishing against the market buy orders.
If buyers exhaust themselves without making progress, the market can reverse quickly once that liquidity disappears.
The reverse is also true.
CVD falling sharply without a corresponding price decline indicates passive buyers absorbing the selling, and therefore potential support.
CVD in a trend and in a range
In a trend
When price and CVD rise together, order flow confirms the trend.
When price rises but CVD stalls or falls, the move lacks buying conviction.
That's often where the most reliable divergences appear.
In a range
In a range, CVD fluctuates without a clear direction.
Buyers and sellers take turns, neither side gaining a lasting advantage, and the reading becomes noisy.
What interests me here is a sudden acceleration in CVD in one direction, accompanied by higher total volume. It's often a sign that consolidation is coming to an end.
How I use CVD in my trading
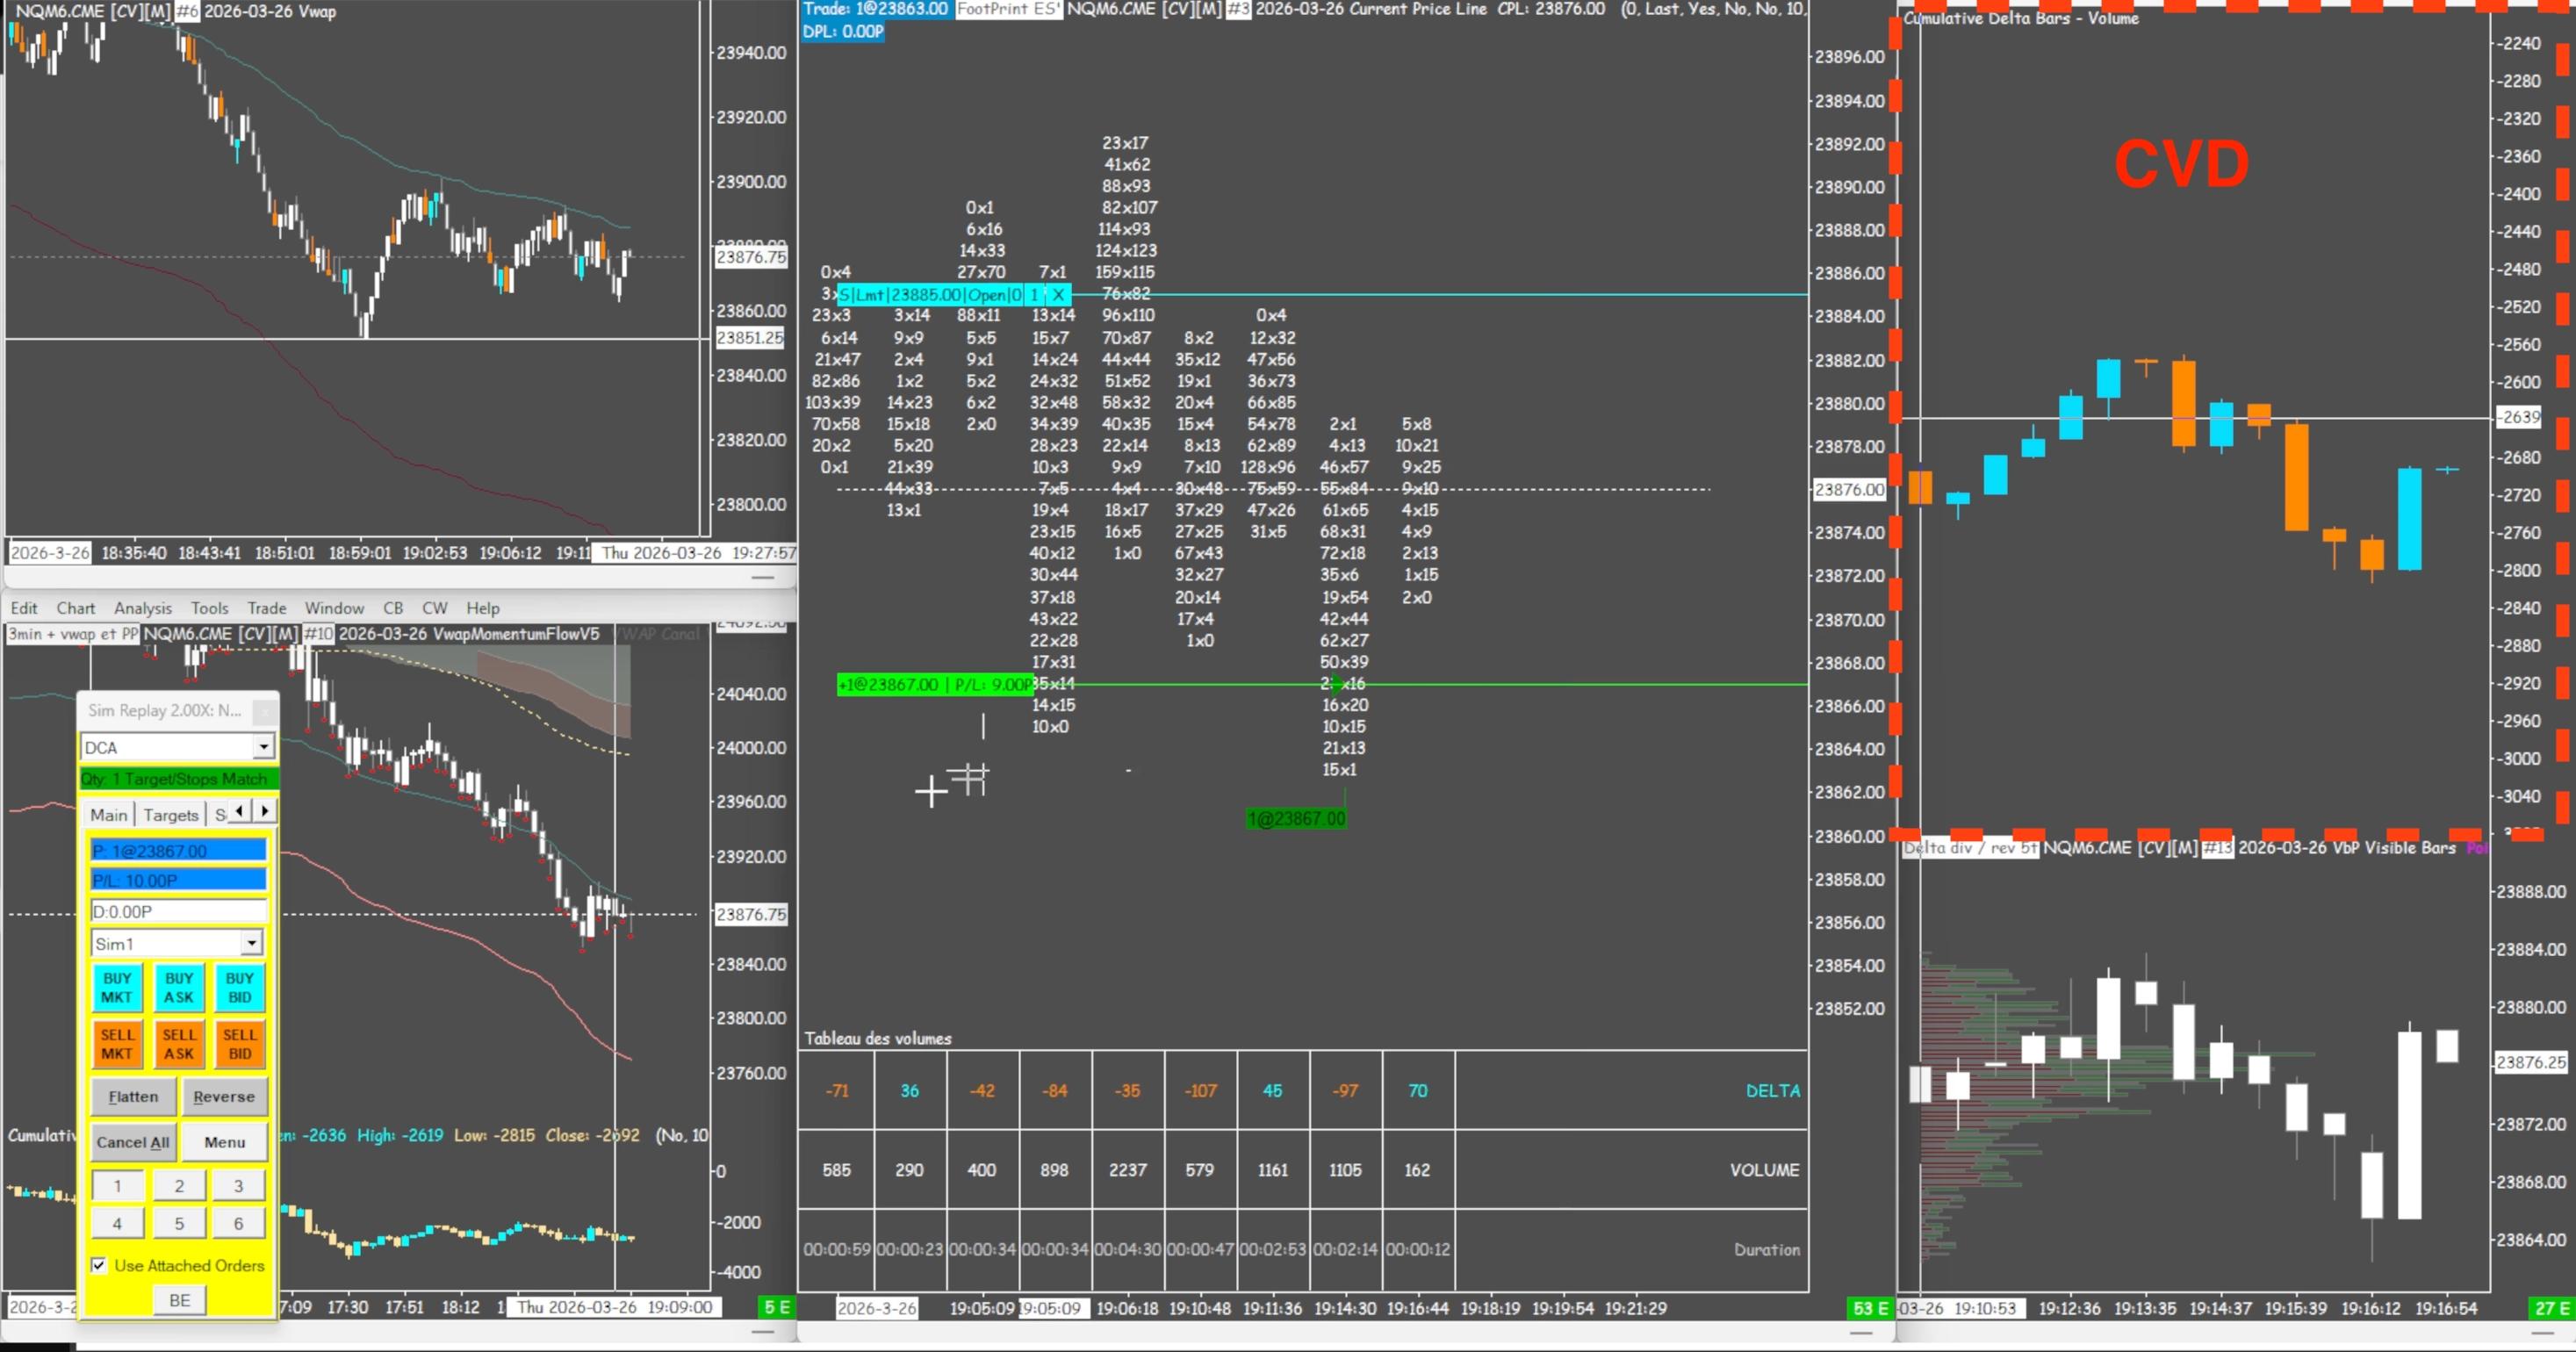
I use CVD alongside other tools:
To confirm an entry: if I'm at a Volume Profile level or a VWAP and CVD starts rising, it confirms that buyers are returning aggressively at that level.
To invalidate a scenario: if I see a CVD/price divergence at my level, I reconsider the entry or wait for further confirmation.
To manage a position: if I'm long and CVD stops rising while price continues higher, I tighten my stop or reduce the position.
Resetting CVD
CVD resets to zero at the start of each session.
On TradingView, the default period is the daily session.
On Sierra Chart, you can configure the reset manually for the session you're interested in.
I leave it set to the daily session.
That's the setting that best matches how institutional participants manage their positions.
