
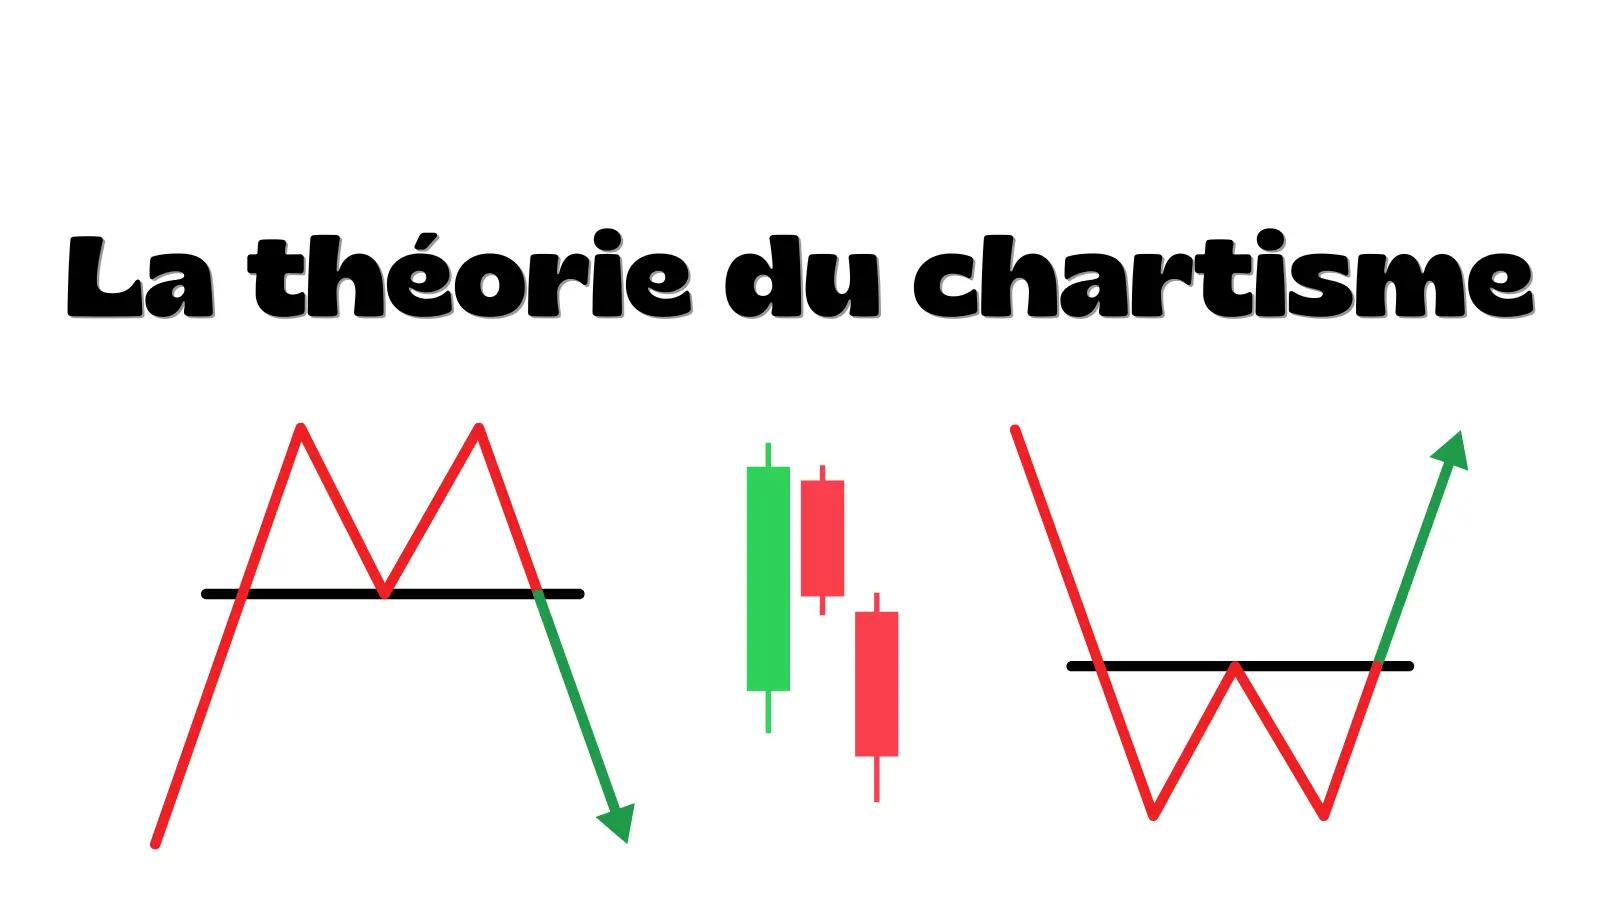
Chart analysis means studying past price movements to anticipate future trends.
It's a very accessible strategy, often popular with beginners because it's visual and easy to get started with.
It breaks down into three steps:
1) Analysing the trend
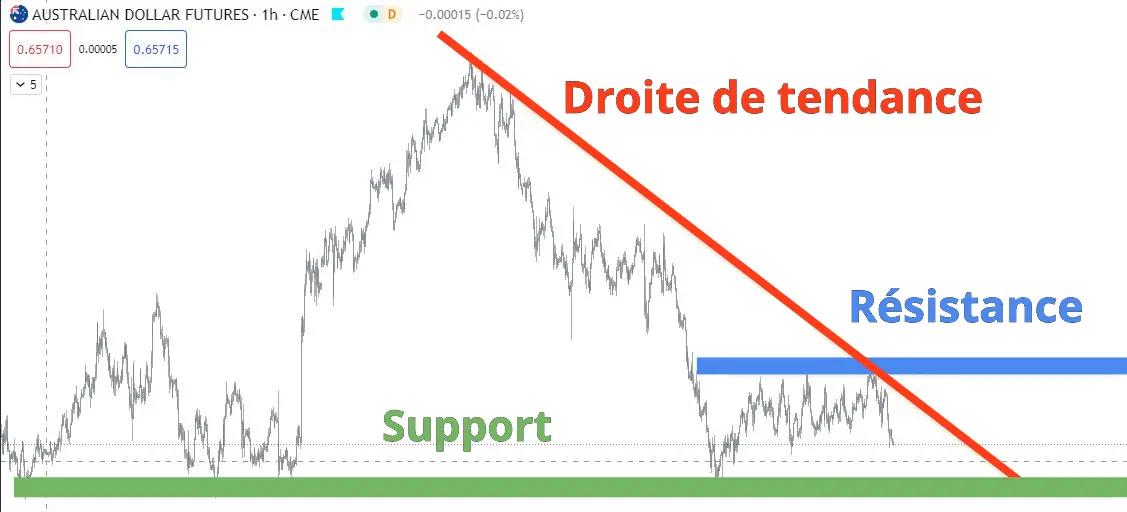
You start with a chart and draw trendlines, support and resistance.
- Trendline: a straight line connecting several successive rising or falling points. This is how you establish the overall trend.
- Support: a level where price tends to stop falling. It's seen as an area with enough buyers to keep price from going lower.
- Resistance: a level where price tends to stop rising. It's seen as an area with enough sellers to keep price from going higher.
The point of drawing these levels is to understand how price is moving and get the wider context, so you can take a trade in the best possible conditions.
2) Recognising chart patterns
Once you've established the price context through trend analysis, the next step is to identify chart patterns.
A pattern is a structure that tends to repeat in the same way under a given set of circumstances.
I'll use an everyday example to make this clear.
It starts raining in Paris, and lots of people decide to take an umbrella when they go out.
The repeating pattern is taking an umbrella when it starts raining.
In trading, patterns are specific shapes you can identify on a chart that reflect the psychology of market participants.
There are two types:
- Those that anticipate a trend reversal
- Those that anticipate a continuation of the trend
One of the best-known examples is the double top, shaped like an M.
It anticipates a trend reversal after two failed attempts at the same resistance.
3) Interpreting technical indicators
Drawing trendlines and identifying patterns isn't enough. You need more elements to support your analysis.
That's where the third and final step in chart analysis comes in: interpreting technical indicators.
A technical indicator is a mathematical analysis tool that uses past data, such as prices or volumes, to give you information at a particular moment.
There are thousands of indicators: RSI, moving averages, Bollinger Bands and more.
Depending on how you trade and your experience, you'll prefer some indicators over others.
Too many beginners get bogged down in charts covered with indicators. It's the best way to confuse your analysis.
I'll focus on the one chart traders use most often: RSI, the Relative Strength Index.
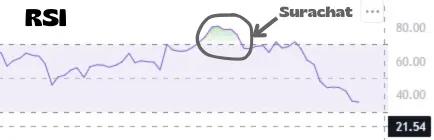
RSI helps identify the end of a trend by showing when the market has bought too much of an asset (overbought) or sold too much of it (oversold).
Overbought: when RSI is above 70
Oversold: when RSI is below 30
Everyone uses RSI in their own way.
Some traders wait for an oversold area to buy, or an overbought area to sell.
Others wait for RSI to return to around 50 before taking a position in the direction of the trend.
How do you apply chart analysis to a trade?
I'll walk you through a concrete example, including the questions you might ask at each stage.
1) The context
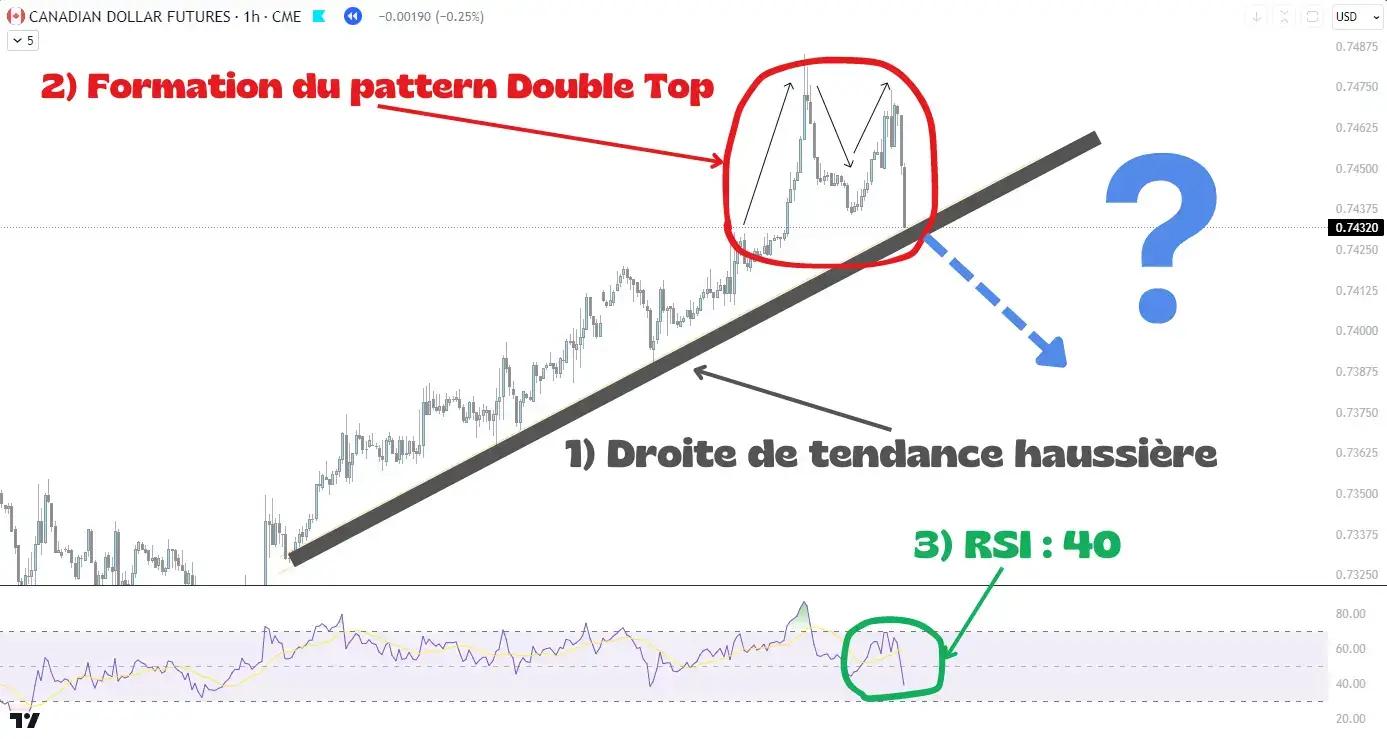
There's an upward trendline that's been in place for a while. The market is in an uptrend.
I can see price moving towards it.
Will price bounce off the trendline, or break through it and head lower?
I don't really know yet. I need to analyse more information to anticipate what comes next.
2) The chart pattern
Looking at the chart, I notice a double top forming.
This pattern anticipates a trend reversal and shows investors losing confidence.
I want to sell the asset, in other words, go short.
3) The technical indicator
I look at RSI. At its current level, the asset isn't oversold. I'd say it still has room to fall.
RSI supports the analysis I made earlier.
I short the asset because, in my view, all the information I now have points to price falling and breaking the trendline.
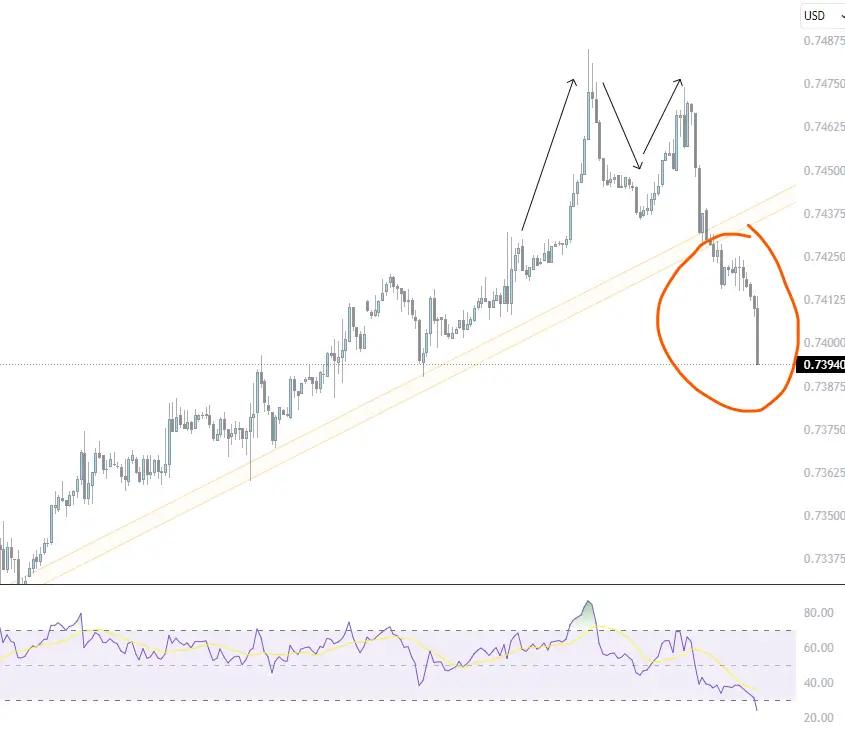
As the chart above shows, my analysis worked perfectly.
I made money on this trade.
If you want to explore technical analysis beyond these basics, you can look at Spéculateur Malin's resources.
The limitations of chart analysis
Although it's the best-known and most widely used trading strategy, it almost always relies on past data: trendlines, indicators and patterns.
But does the future always repeat the past?
Chart traders certainly hope so.
I'll leave you to make up your own mind.
It's a big debate in trading, and I'll leave the question open.
