
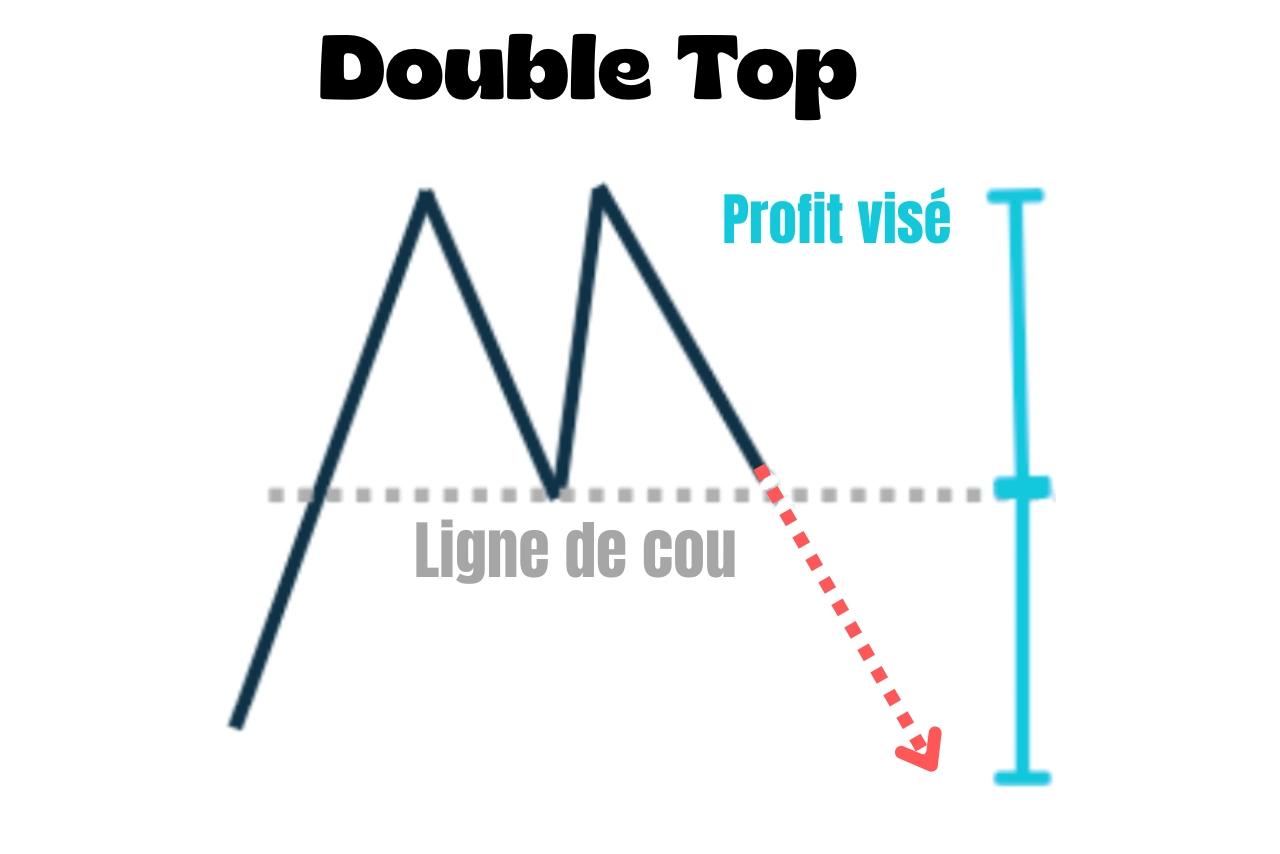
What is a double top?
A double top is a bearish reversal chart pattern that forms at the end of an uptrend.
It shows that the market can't get past a price level despite two attempts.
How do you recognise it?
- An uptrend comes before the pattern
- Two highs form at the same level, separated by a pullback that creates the neckline
- Both highs must stall at the same resistance level
- A break below the neckline confirms the pattern
Here's a real example of a double top on NASDAQ 100 futures:
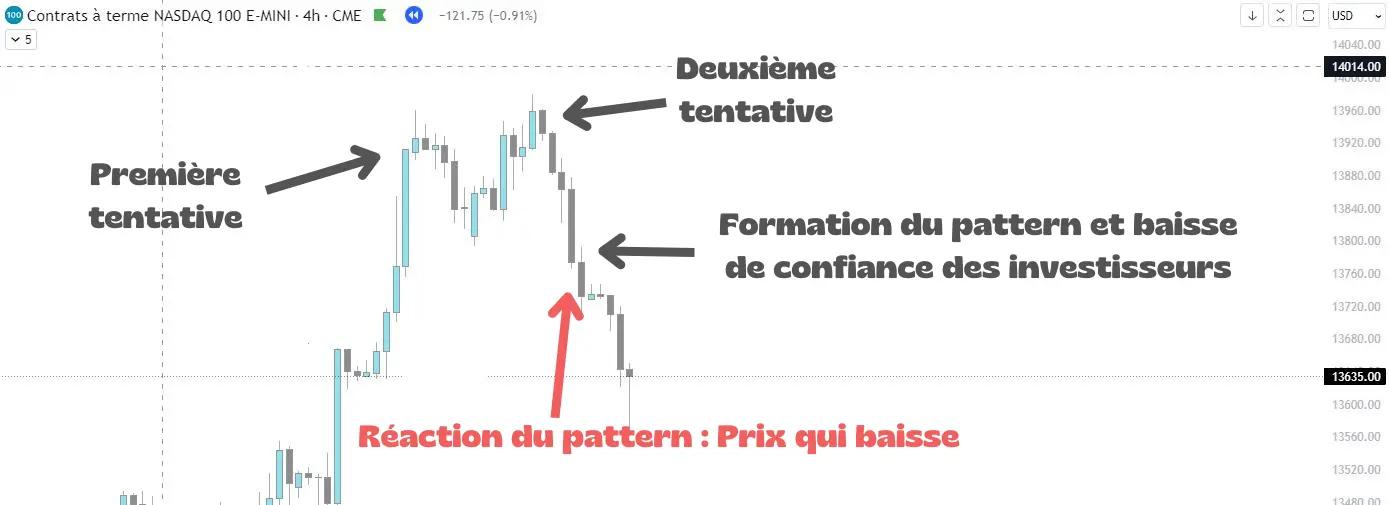
Like its opposite, the double bottom, it can appear on any timeframe.
The psychology behind the pattern
At the first high, sellers enter at resistance and push price lower, creating the pullback towards the neckline.
Price rises again as buyers believe the trend is resuming, but this second attempt fails in the same place.
This second failure shifts the balance. Buyers who have held their positions from the start begin to doubt themselves.
Those who entered at the first resistance test see their scenario being confirmed.
When price breaks below the neckline, the remaining buyers' stop-losses trigger and add to the decline.
How do you trade a double top?
The signal to watch for is a candle closing below the neckline after the second high.
There are then two ways to enter:
- Enter on confirmation: go short as soon as price moves below the neckline and closes beneath it
- Wait for a return to the neckline: after the breakout, price sometimes retests this level before continuing lower
The stop can go above the two highs.
