
What is a double bottom?
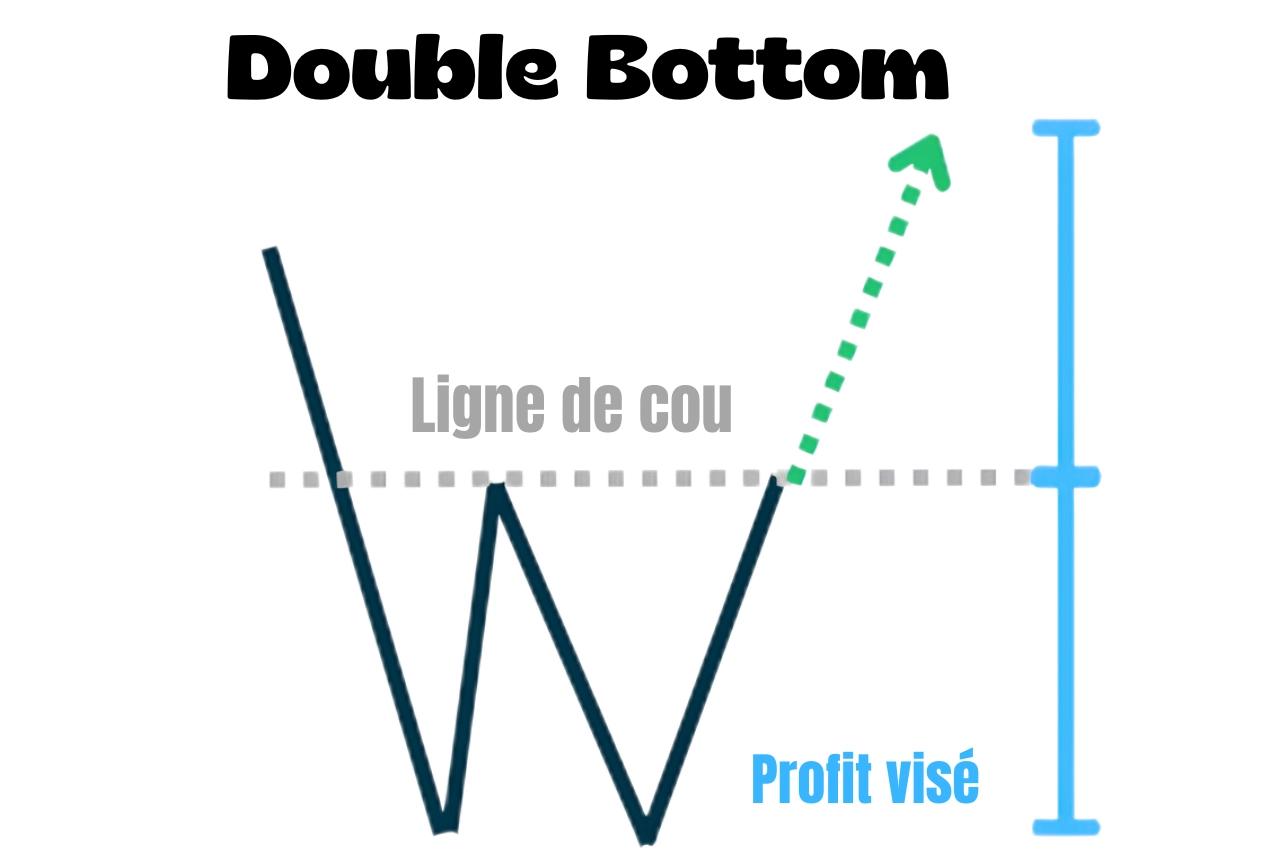
A double bottom is a bullish reversal chart pattern that appears after a downtrend.
It shows sellers gradually losing control of the market as buyers start taking over.
How do you recognise it?
The first thing to check is the context: there must be a downtrend before the pattern.
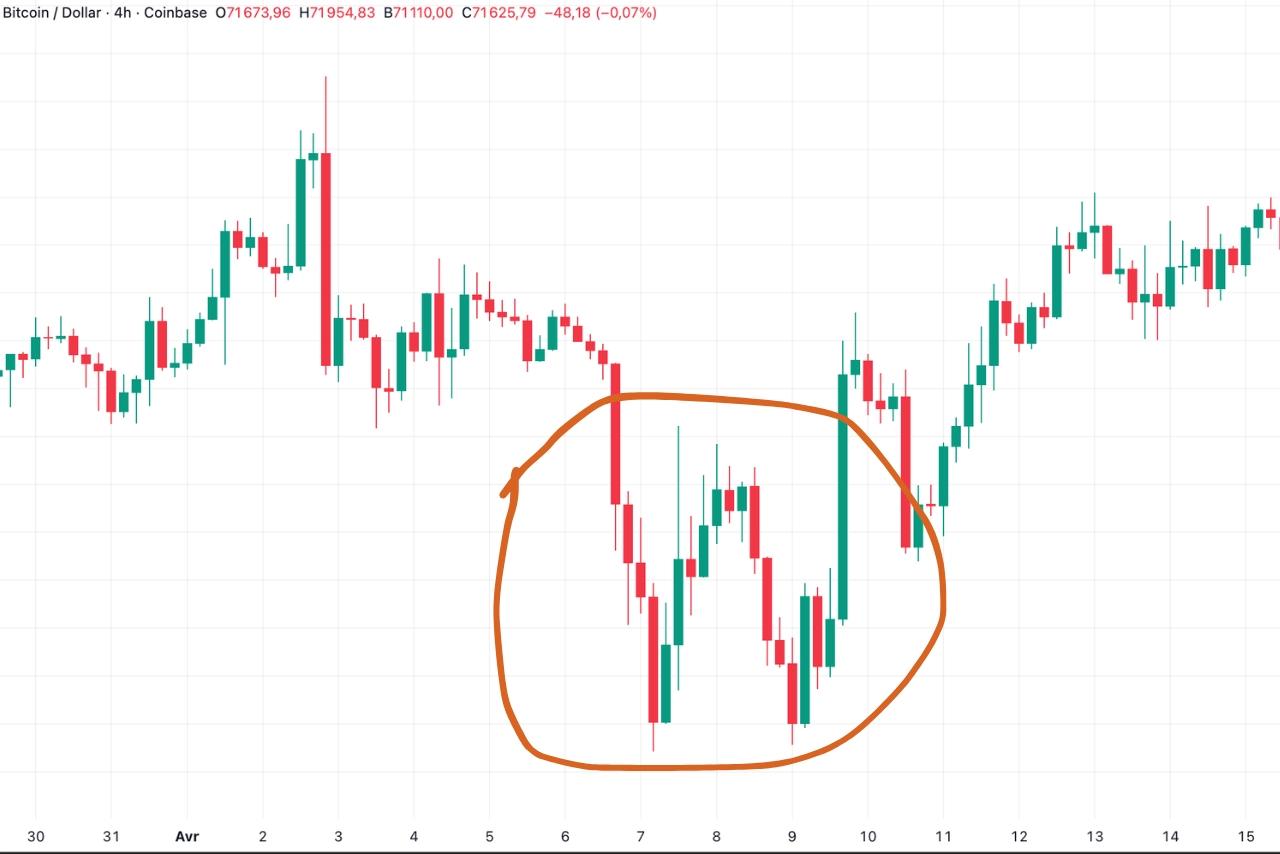
The pattern forms with two lows at roughly the same level, separated by a rebound.
That rebound creates a high called the neckline.
A break above the neckline confirms the pattern.
The difference from a simple range, where the market moves around the same area without a clear trend, often shows up at the second low.
On this second test, volume often tends to fall, a sign that selling pressure is weakening.
You can find double bottoms on any timeframe, including hourly, four-hourly and daily charts. Shorter timeframes generally produce more false signals.
The same reasoning works in reverse for a double top, the bearish version of the pattern.
The psychology behind the pattern
At the first low, sellers drive price down to an area where buyers react.
That reaction produces a rebound towards the neckline.
Price then returns to the same support a second time, but sellers no longer have enough strength to push through it.
Volume on this second test is often lower.
Meanwhile, buyers who missed the first entry see this second low as confirmation that the level is holding.
They start taking positions.
When price breaks above the neckline, short sellers are forced to close.
Their stop-losses fuel the move and accelerate the rise, strengthening the pattern's confirmation.
How do you trade a double bottom?
The trading signal appears when price moves above the neckline and the candle closes above that level.
Technical indicators such as RSI or moving averages can strengthen the signal.
There are then two ways to enter:
- Enter on confirmation: buy as soon as price moves above the neckline and closes above it
- Wait for a return to the neckline: after the breakout, price may retest the level before moving higher again
The stop-loss can go below the area of the pattern's lows.
