
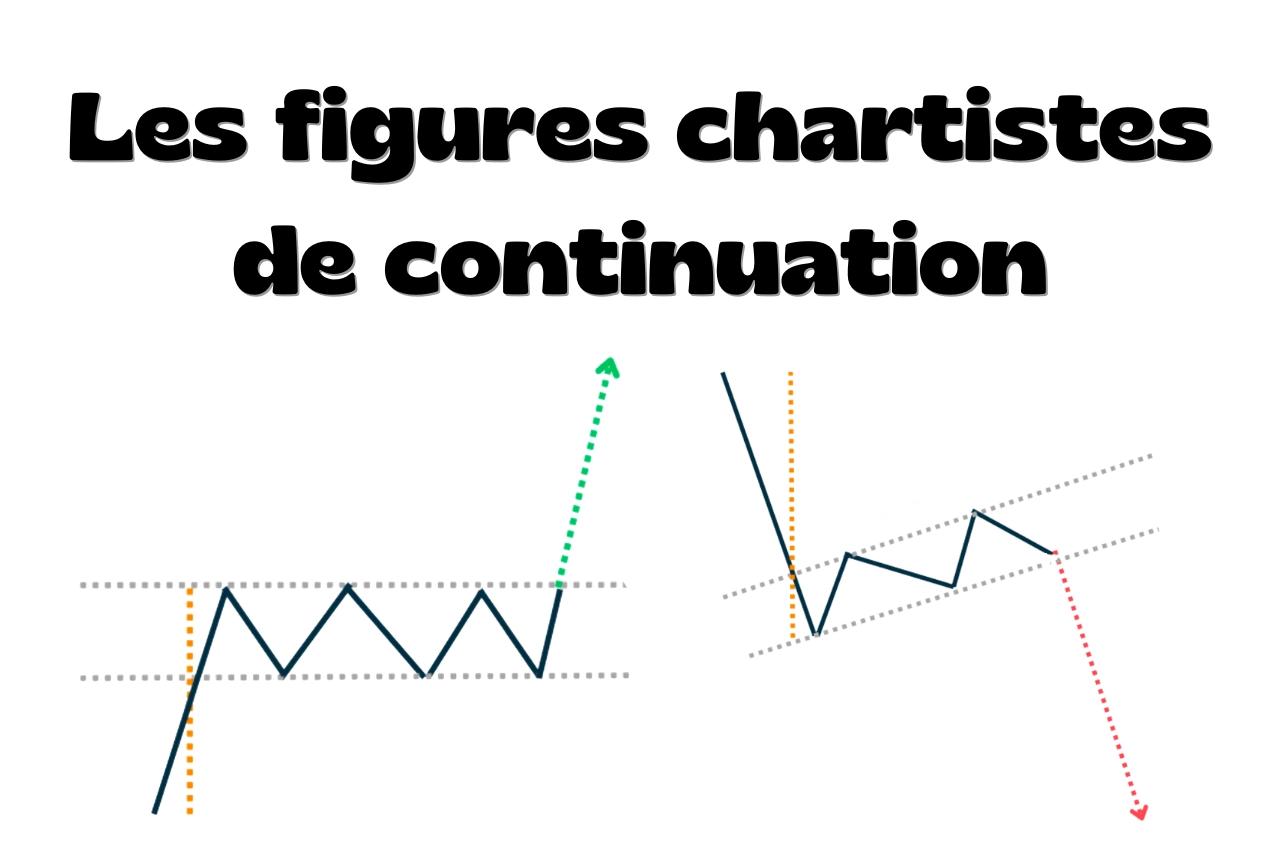
A continuation chart pattern is a pattern showing that price is taking a pause before resuming the current trend.
Unlike a reversal pattern, it doesn't signal a change of direction, but a possible resumption of the original move.
How do you recognise a continuation pattern?
A continuation pattern appears after a rise or decline is already underway.
After that first move, price stops making clear progress and enters a consolidation.
On the chart, this consolidation forms an area bounded by levels or trendlines.
As long as price stays inside this structure, there isn't a continuation signal yet.
The signal appears when price breaks out of the pattern in the direction of the previous trend.
How do you confirm a continuation pattern?
A continuation pattern is confirmed when price breaks the level defining its boundary.
Confirmation can come from:
- A breakout from a channel
- A break above resistance
- A break below support
The breakout must follow the original trend's direction to confirm that the move is continuing.
How do you use a continuation chart pattern?
The strategy is to identify an ongoing trend, then a consolidation within that move.
You then wait for price to break out of the pattern before considering an entry.
From that signal, you can define:
- An entry point
- An invalidation level
- A price target
Technical indicators such as RSI can also help confirm the signal.
The main continuation chart patterns
Here are the main continuation patterns, the expected scenarios and the breakout levels to watch for confirmation.
| Continuation pattern | Potential signal | Confirmation to wait for |
|---|---|---|
| Bull flag | Bullish continuation | Break above resistance |
| Bear flag | Bearish continuation | Break below support |
| Bullish pennant | Bullish continuation | Break above resistance |
| Bearish pennant | Bearish continuation | Break below support |
| Bullish rectangle | Bullish continuation | Break above resistance |
| Bearish rectangle | Bearish continuation | Break below support |
| Ascending triangle | Possible bullish continuation | Break above resistance |
| Descending triangle | Possible bearish continuation | Break below support |
| Bullish symmetrical triangle | Possible bullish continuation | Break above the upper boundary |
| Bearish symmetrical triangle | Possible bearish continuation | Break below the lower boundary |
| Ascending channel | Bullish continuation | Break above resistance |
| Descending channel | Bearish continuation | Break below support |
| Cup and handle | Bullish continuation | Break above the upper boundary |
| Inverse cup and handle | Bearish continuation | Break below the lower boundary |
