
S&P 500
The S&P 500 has been in a strong uptrend since early April.
Pivot points have been rising week after week, volume has supported the move, and the market is now at all-time highs.
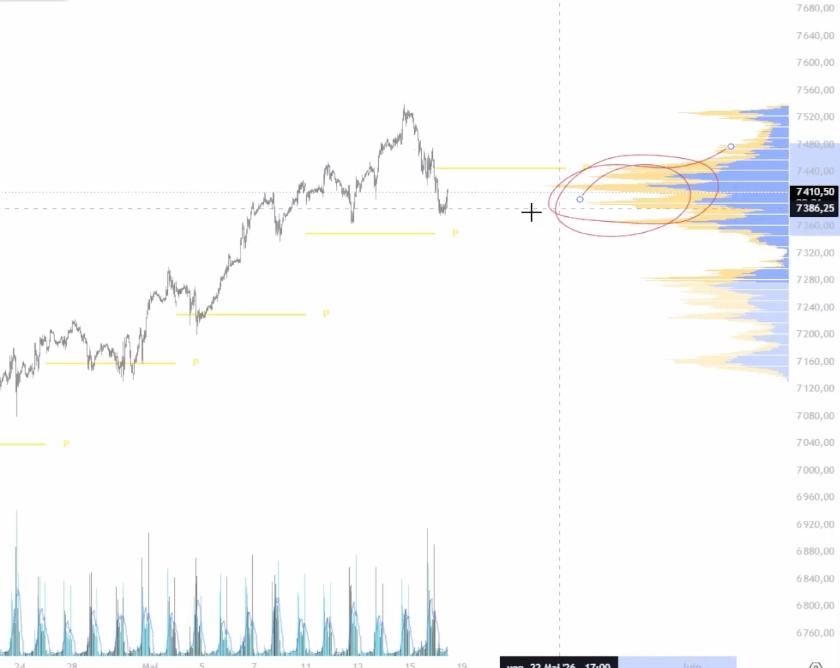
In these conditions, I’d rather keep looking for longs than try to predict a reversal.
A market being very high isn’t enough to justify selling it.
As long as the trend is up and momentum is there, I prefer to trade with the move.
The zone below 7,320 is still worth watching.
If price returns there, I’ll mainly be looking for buyers to come back with volume.
If they do, that could offer a long opportunity, with an initial target around the zones where volume has recently concentrated.
If the market bounces well from that area, there may be room to ride it higher.
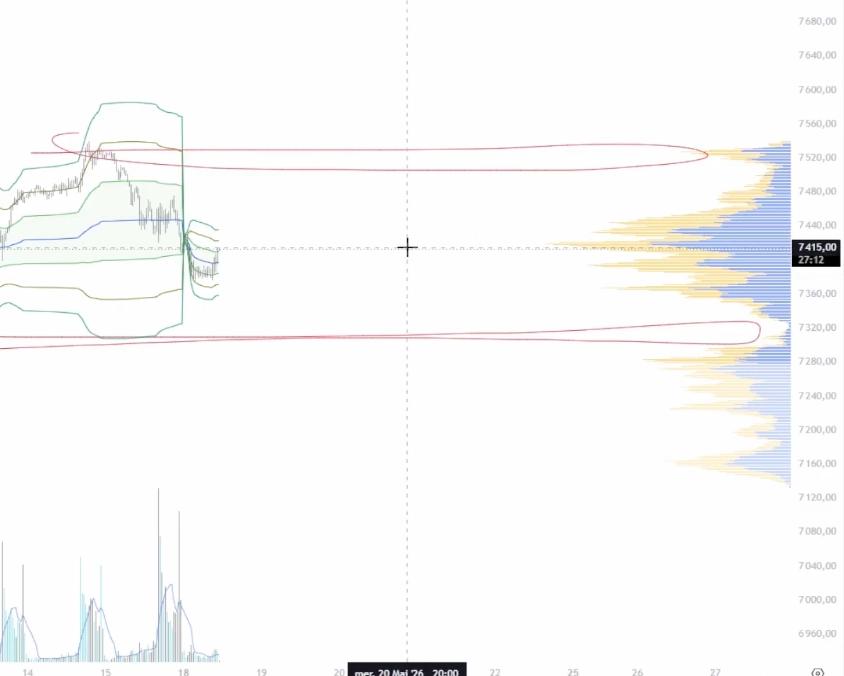
But I don’t want to buy just anywhere or take too much risk, with the market already at all-time highs.
Buyers who entered in April have several weeks of gains behind them.
If the market stalls and stops making new highs, some may take profits.
And if lots of buyers exit together, the decline can accelerate quickly.
My main S&P 500 scenario is still bullish, but with more cautious risk management.
Nasdaq
Nasdaq is in a fairly similar position.
Prices remain high, momentum is still positive, and the areas between the weekly pivot and VWAP could be interesting places to look for longs.
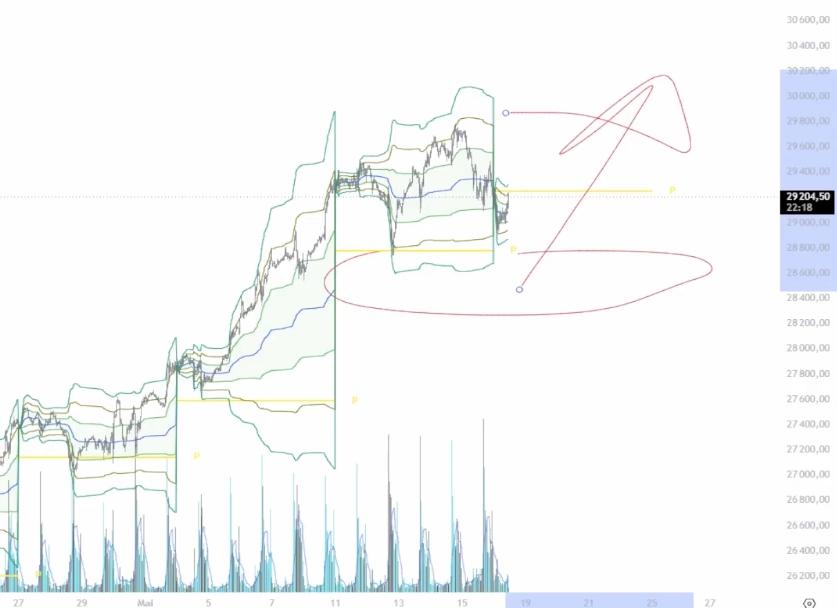
That said, if I have to choose, I prefer the S&P 500.
It looks stronger to me, holds up better during declines and responds better when the market starts climbing again.
Nasdaq could offer opportunities to buy pullbacks, but it isn’t my first choice this week.
Gold
Gold is in a different situation.
Since April, it has mostly traded within the same area after March’s sharp decline.
Unlike US indices, there’s no clear trend. This is more of a consolidating market.
The important level is around 4,700 on the futures contract.
That’s where the most volume has traded.
As long as price stays around it, I consider the market to be in balance.
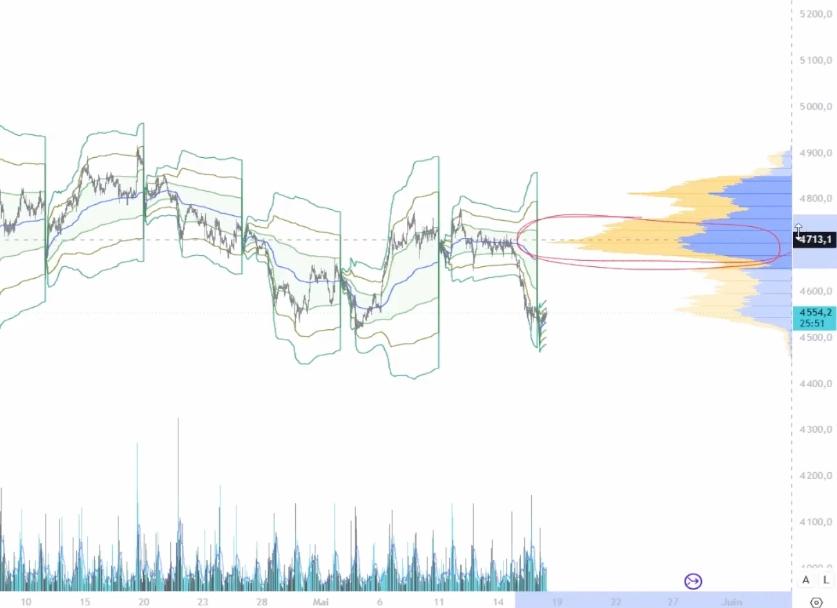
In this kind of setup, I prefer buying the lower areas and selling the upper areas, aiming for a return towards the middle.
In other words, until the market clearly breaks its range, I’m not necessarily looking for a big trend.
I’m looking to trade moves back towards the levels where price has traded most.
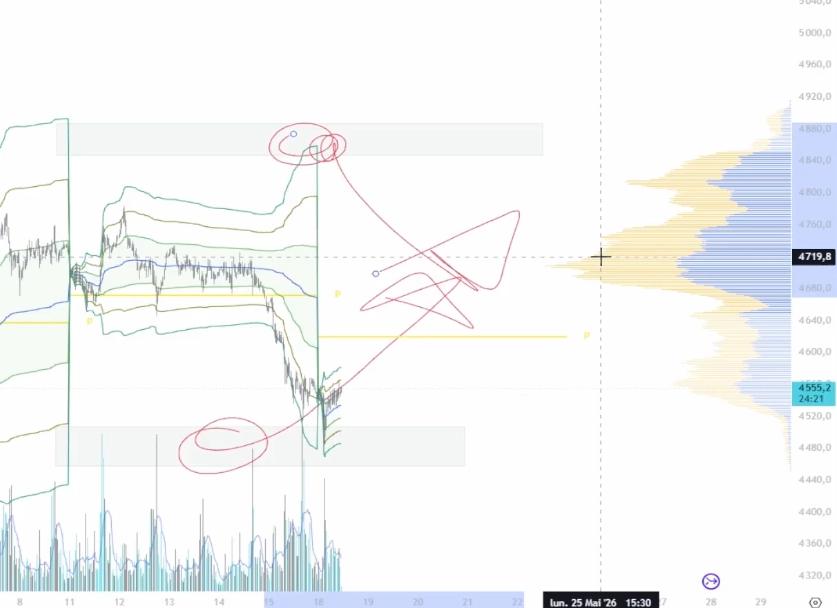
Pivot points, VWAP and volume areas can then help define targets.
If I buy near the bottom, I can target the pivot, VWAP or the highest-volume area, depending on how price reacts.
If the market returns to an upper area, I can look for the opposite setup with a short.
That reading holds as long as the key levels hold.
If gold breaks below 4,400 on the futures contract, or clearly below 4,500 on the CFD, I’ll avoid longs.
In that case, I’ll look to sell bounces instead.
Oil
Oil remains difficult to trade in current conditions.
Weekly ranges are very large, often around 12% to 15%, making risk management much harder.
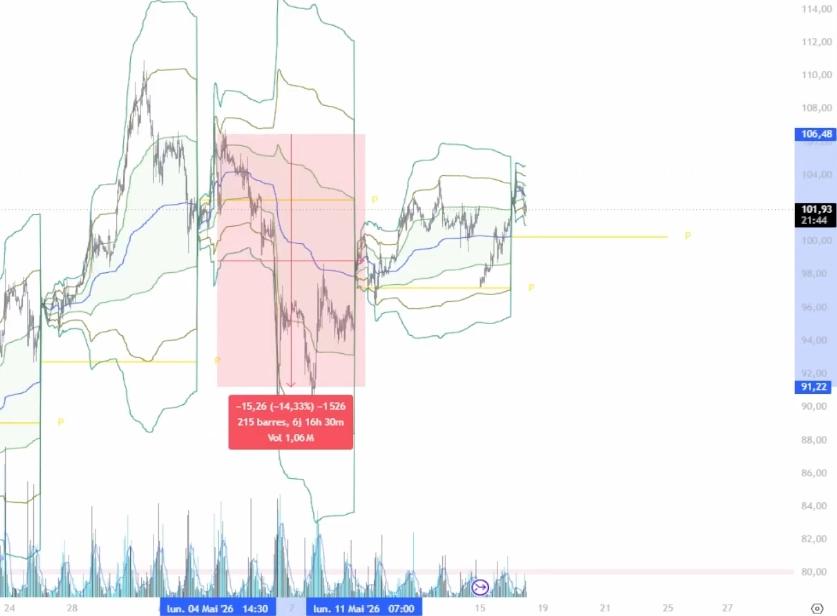
It isn’t just about picking the right direction.
You also need to place a sensible stop, adjust your position size and keep risk reasonable.
For now, I’d rather leave oil alone and focus on markets that are easier to work with, such as gold.
Bitcoin
Bitcoin’s decline continues, and the 81,000 area has seen several strong selling reactions.
Until the market reclaims that area or shows a genuine buying response, I’ll stay cautious.
If sellers remain in control, a return to previously traded levels around 70,000 is still possible.
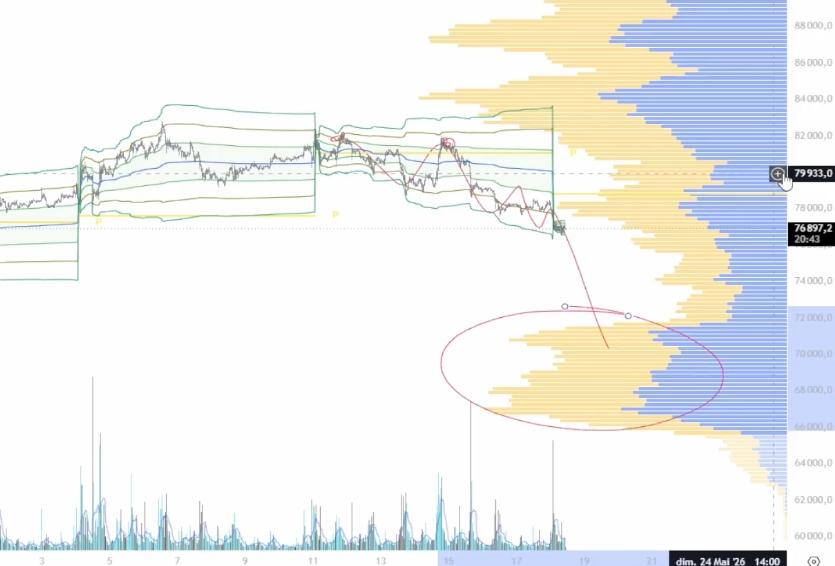
The market has traded around that level before, so it could become important again if the decline continues.
For now, I see no reason to anticipate a reversal until buyers clearly take back control.
This analysis is not investment advice.