
Markets are trading in conditions similar to last week’s.
My plans are broadly unchanged, but I’ll approach intraday and swing trading differently.
Bitcoin
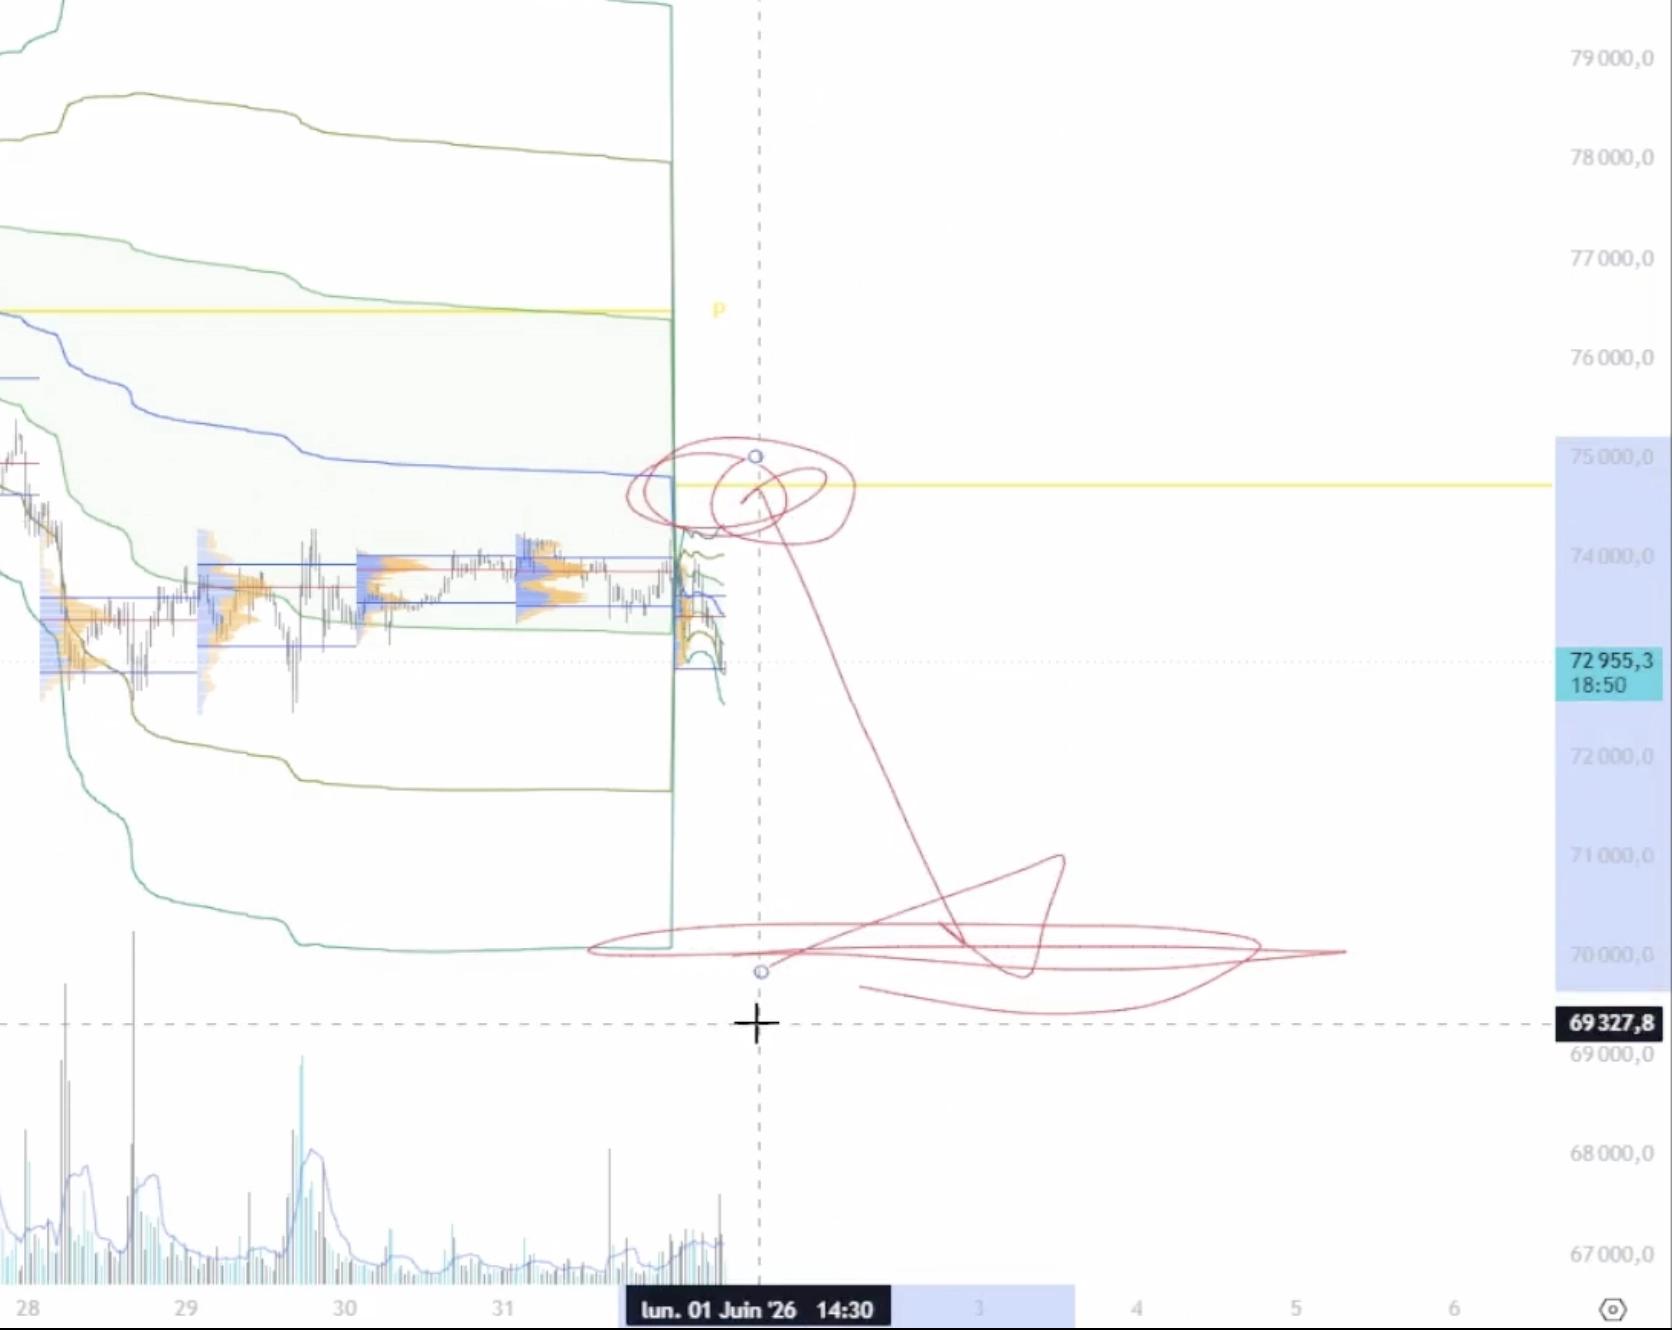
For two weeks now, I’ve been watching for a possible move back towards $70,000.
Last week, the market was still at a standstill.
This time, the 7% to 8% decline shows that selling pressure is still present in the short term.
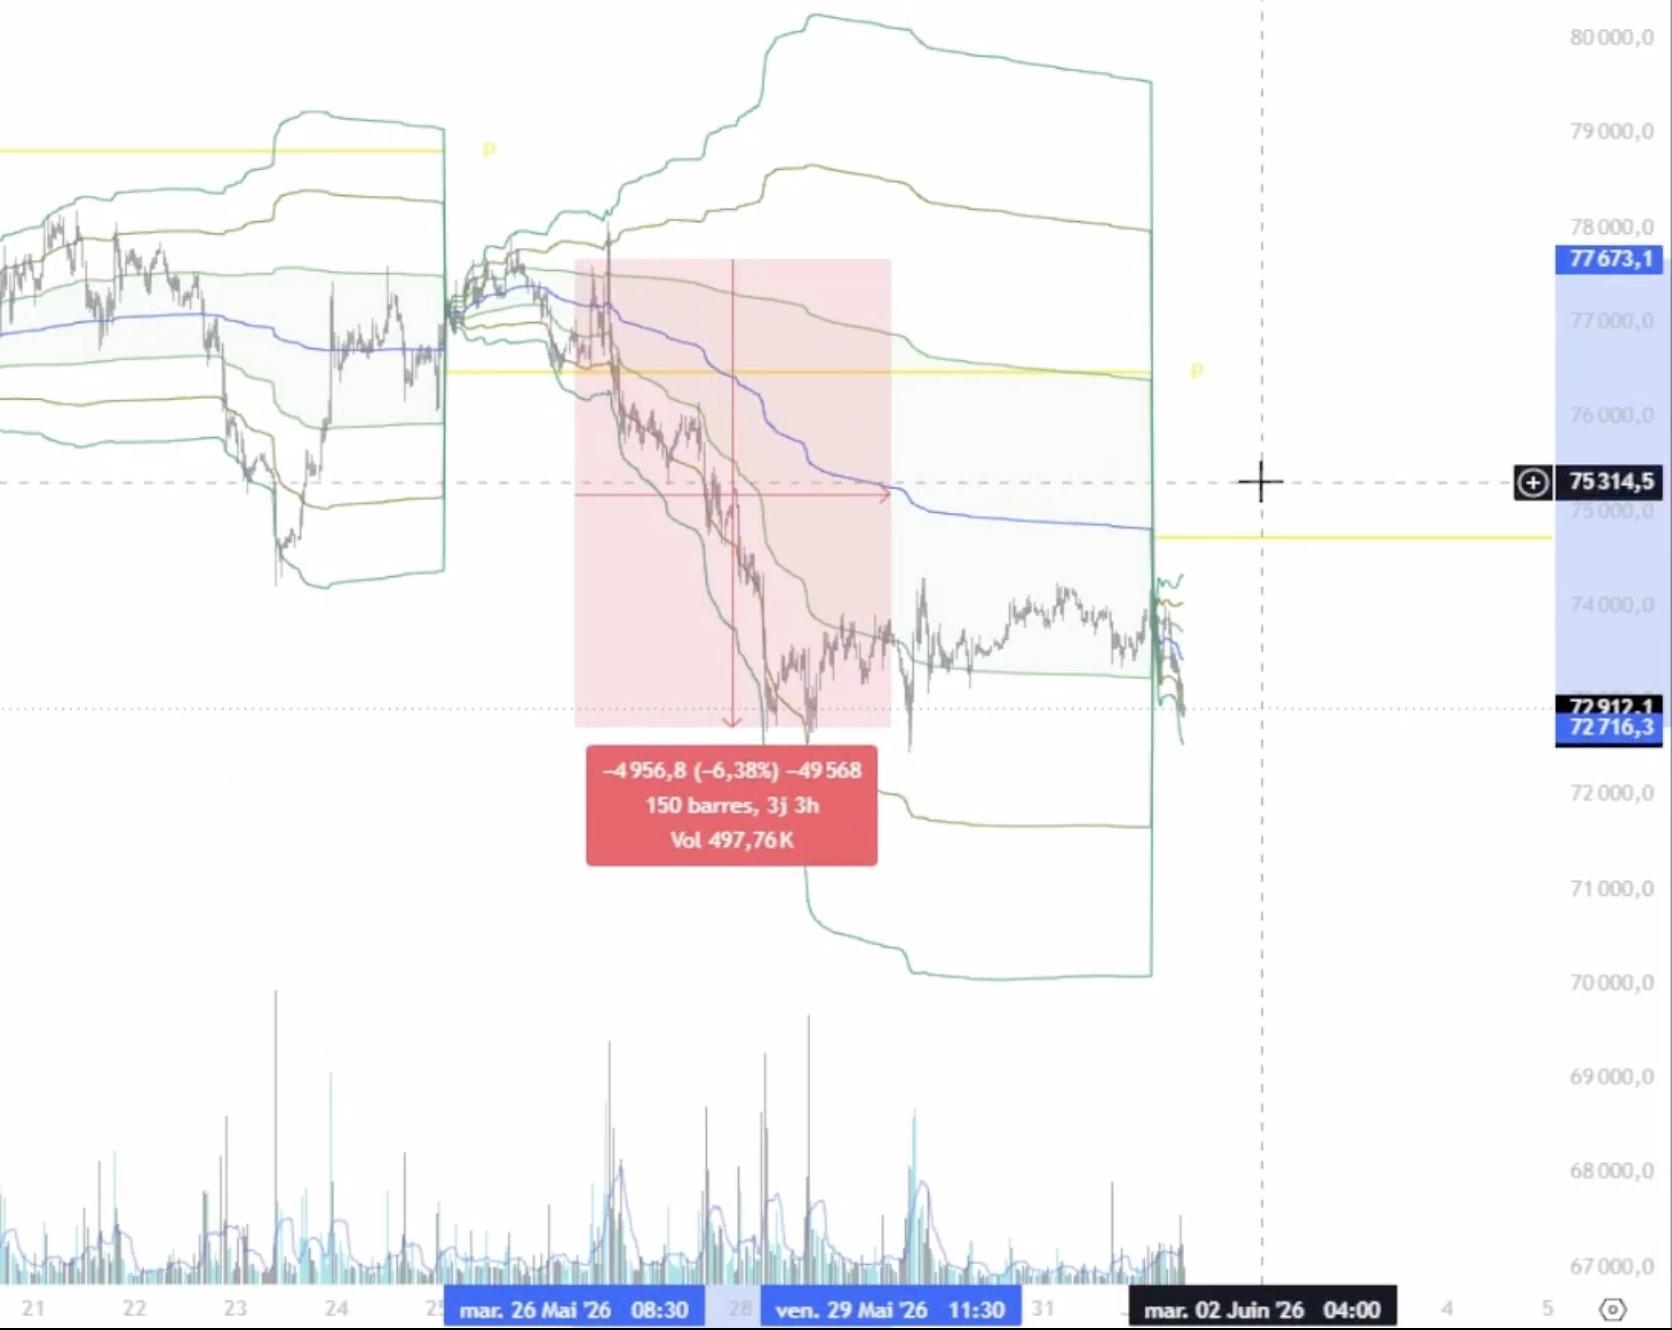
In my view, that selling pressure isn’t finished until price reaches the lower zones I’m watching.
So I’m still favouring shorts.
Intraday, I could look for shorts around VWAP, with small profit targets.
For a swing trade targeting around $70K, though, I’ll wait for an entry at the extremes where the past few days’ POCs cluster, to give the trade more room for continuation.
US indices
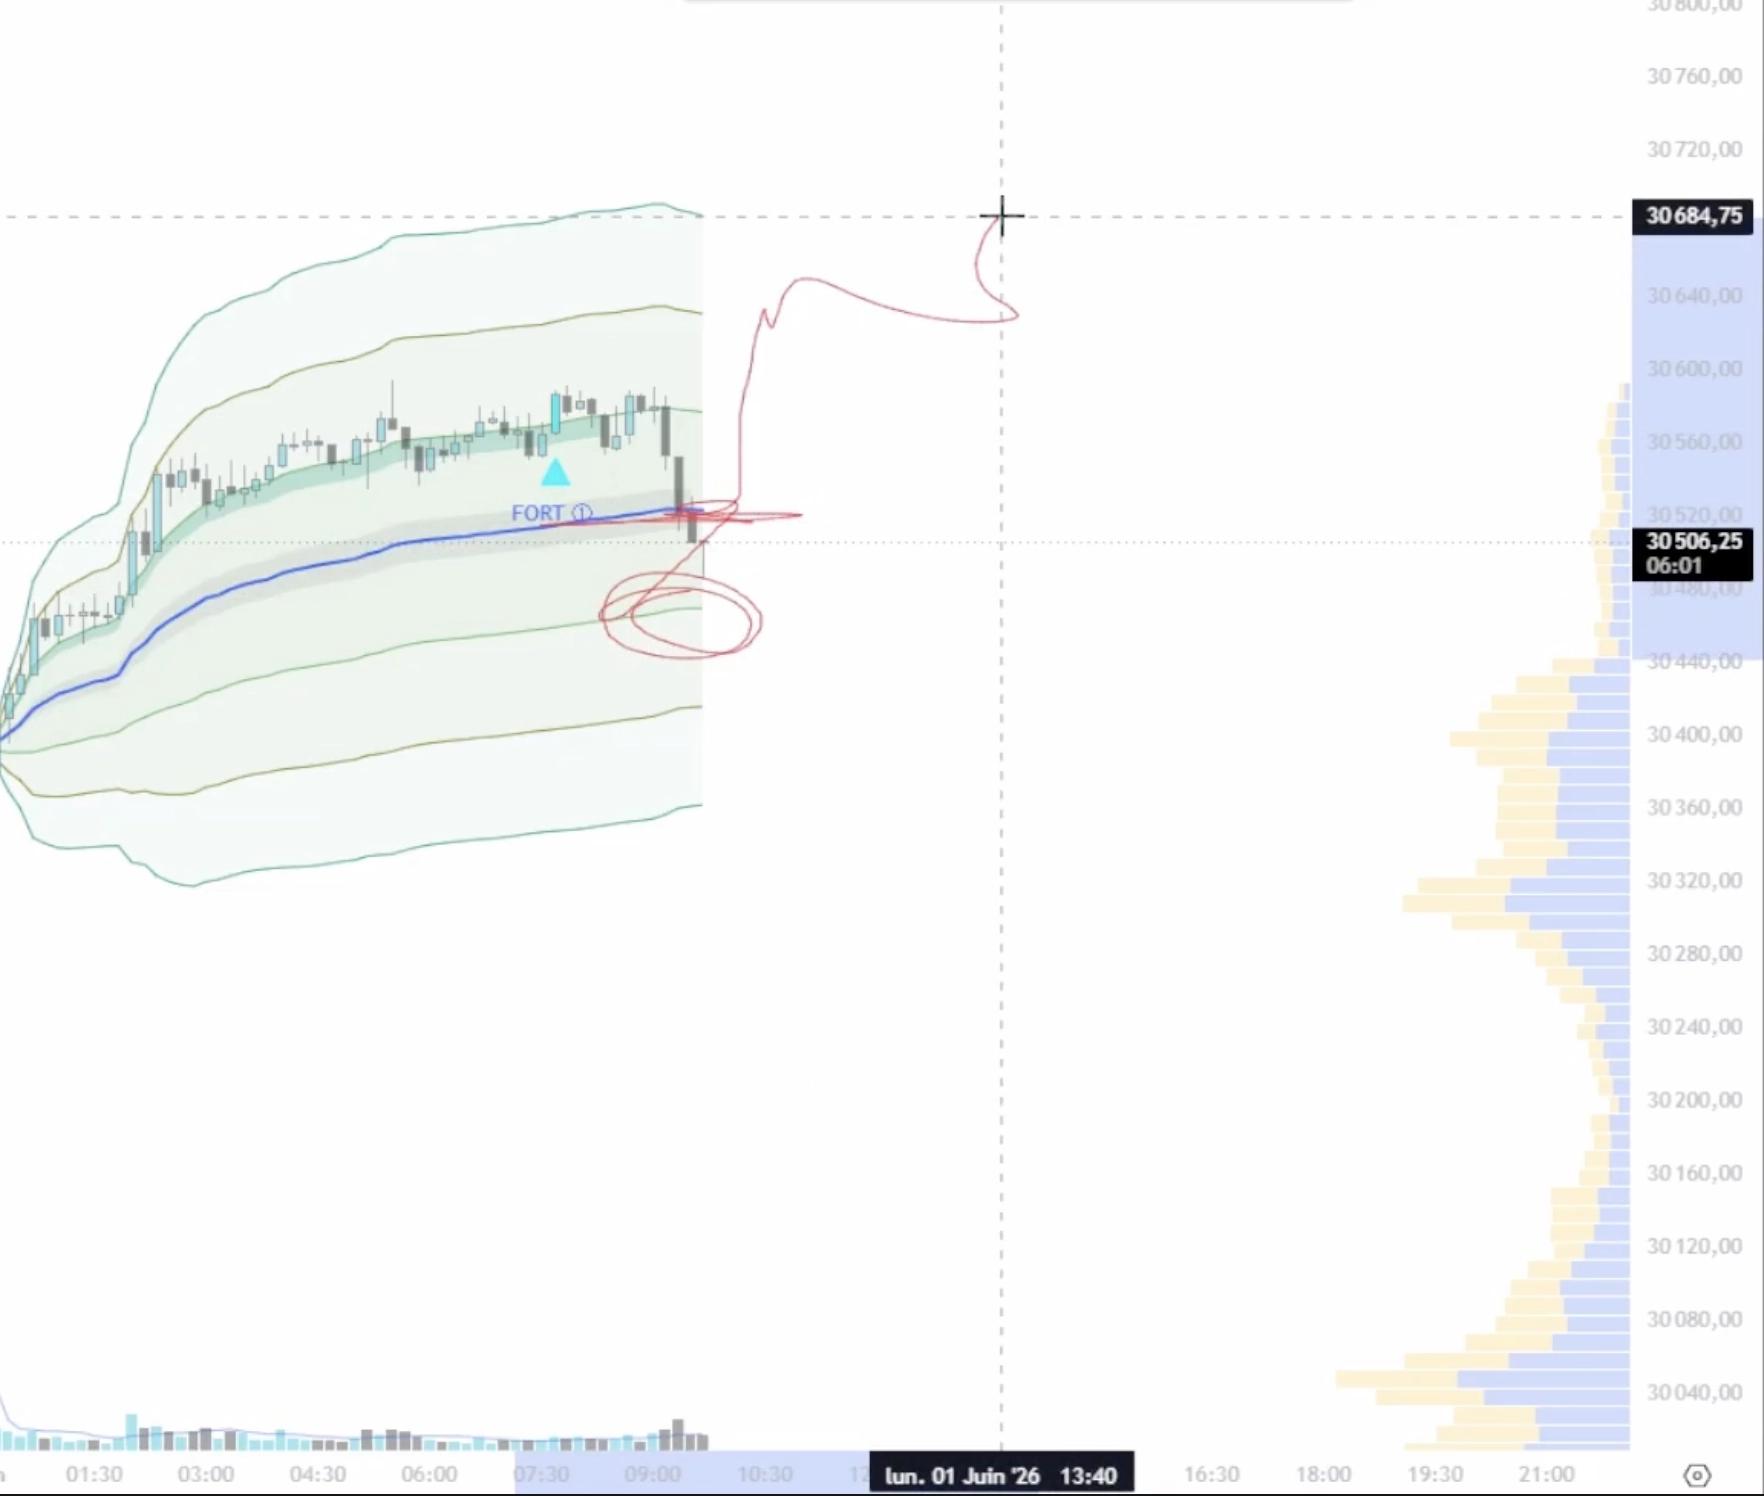
The S&P 500 and Nasdaq are at their highs without a natural pullback, making precise buying zones harder to find.
The areas I identified last week were never reached, and the situation has been much the same for three weeks.
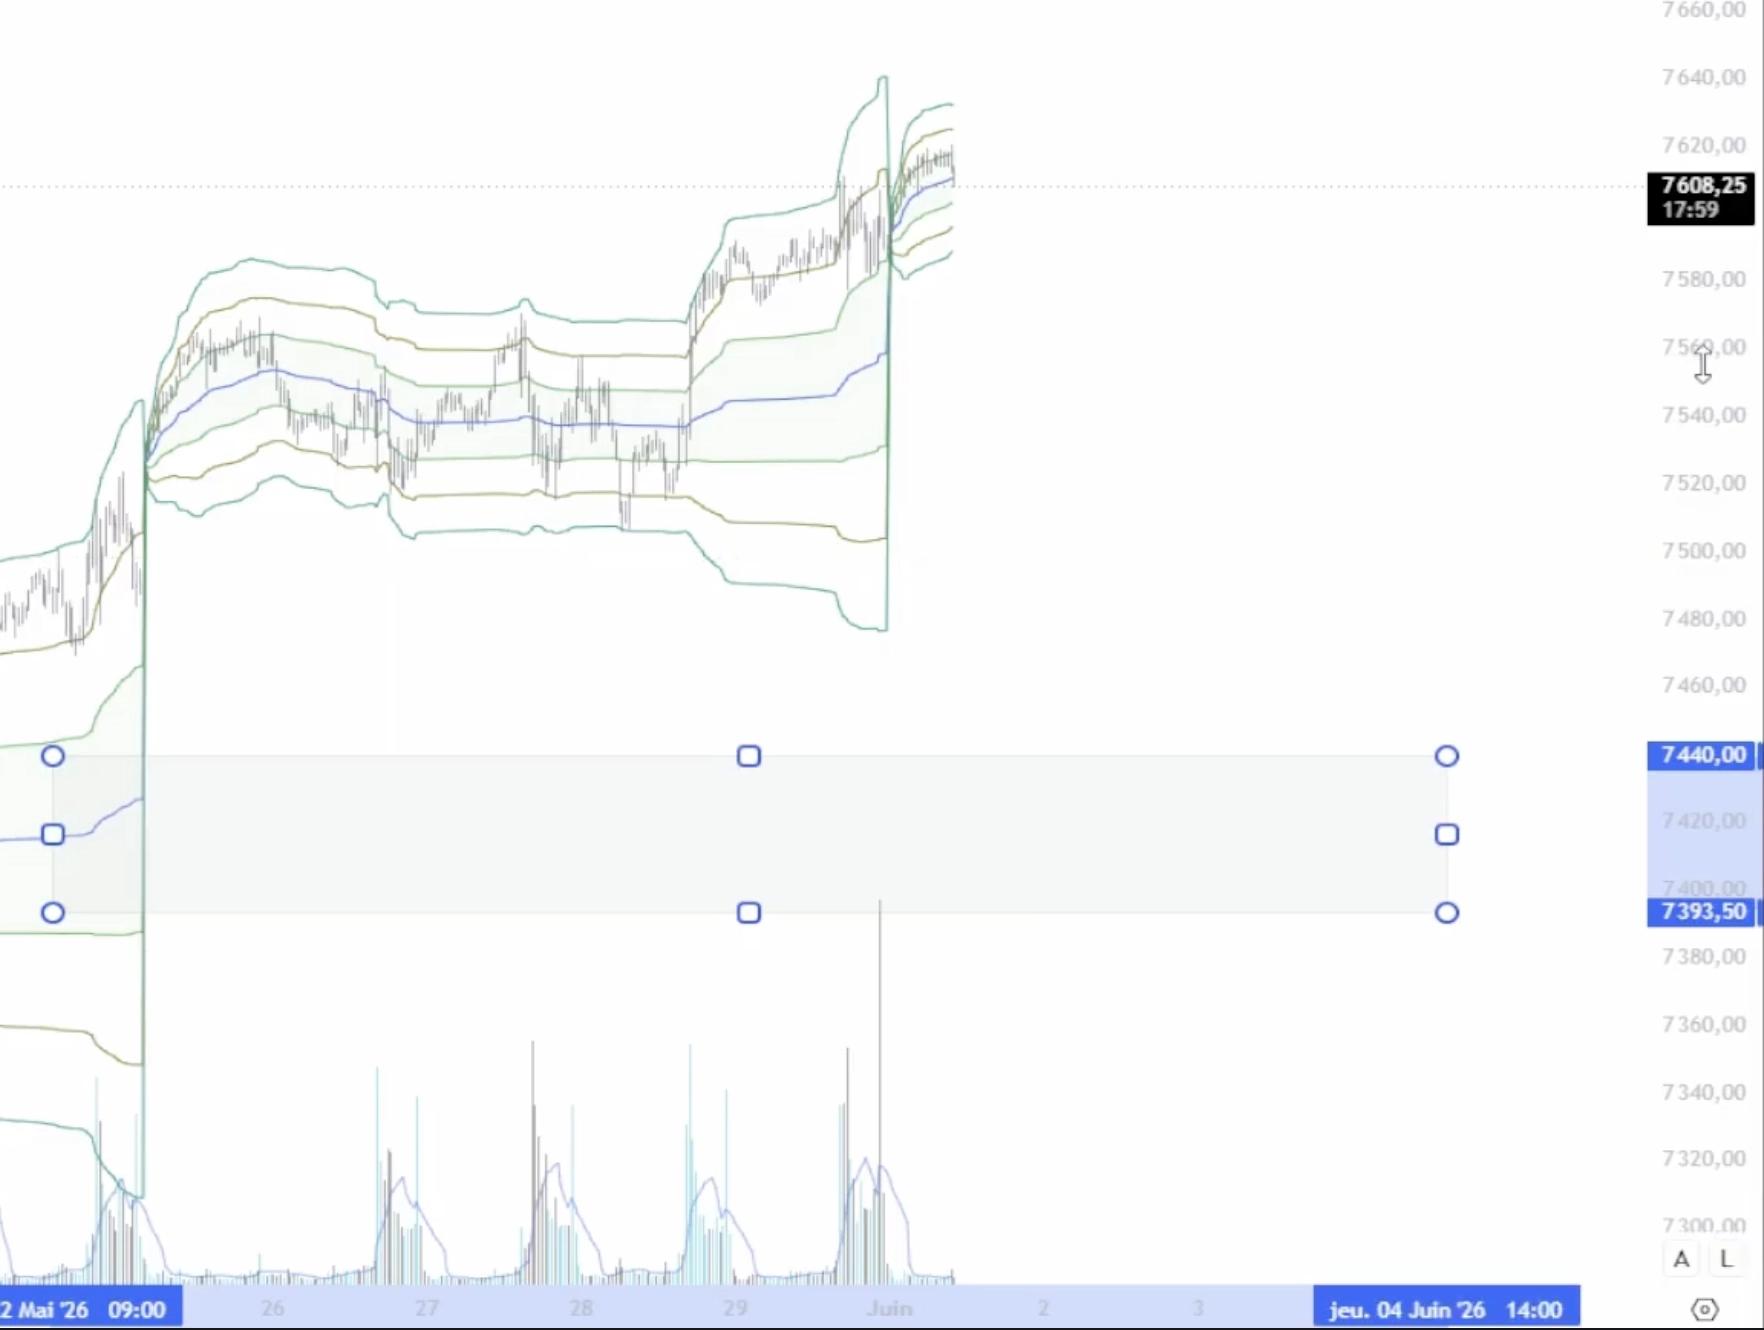
On Nasdaq, a lot of volume is concentrated at 30,000. To me, that makes it an important area of acceptance.
Below it, prices may look cheap. My concern is that this could signal heavy unloading rather than a real buying opportunity.
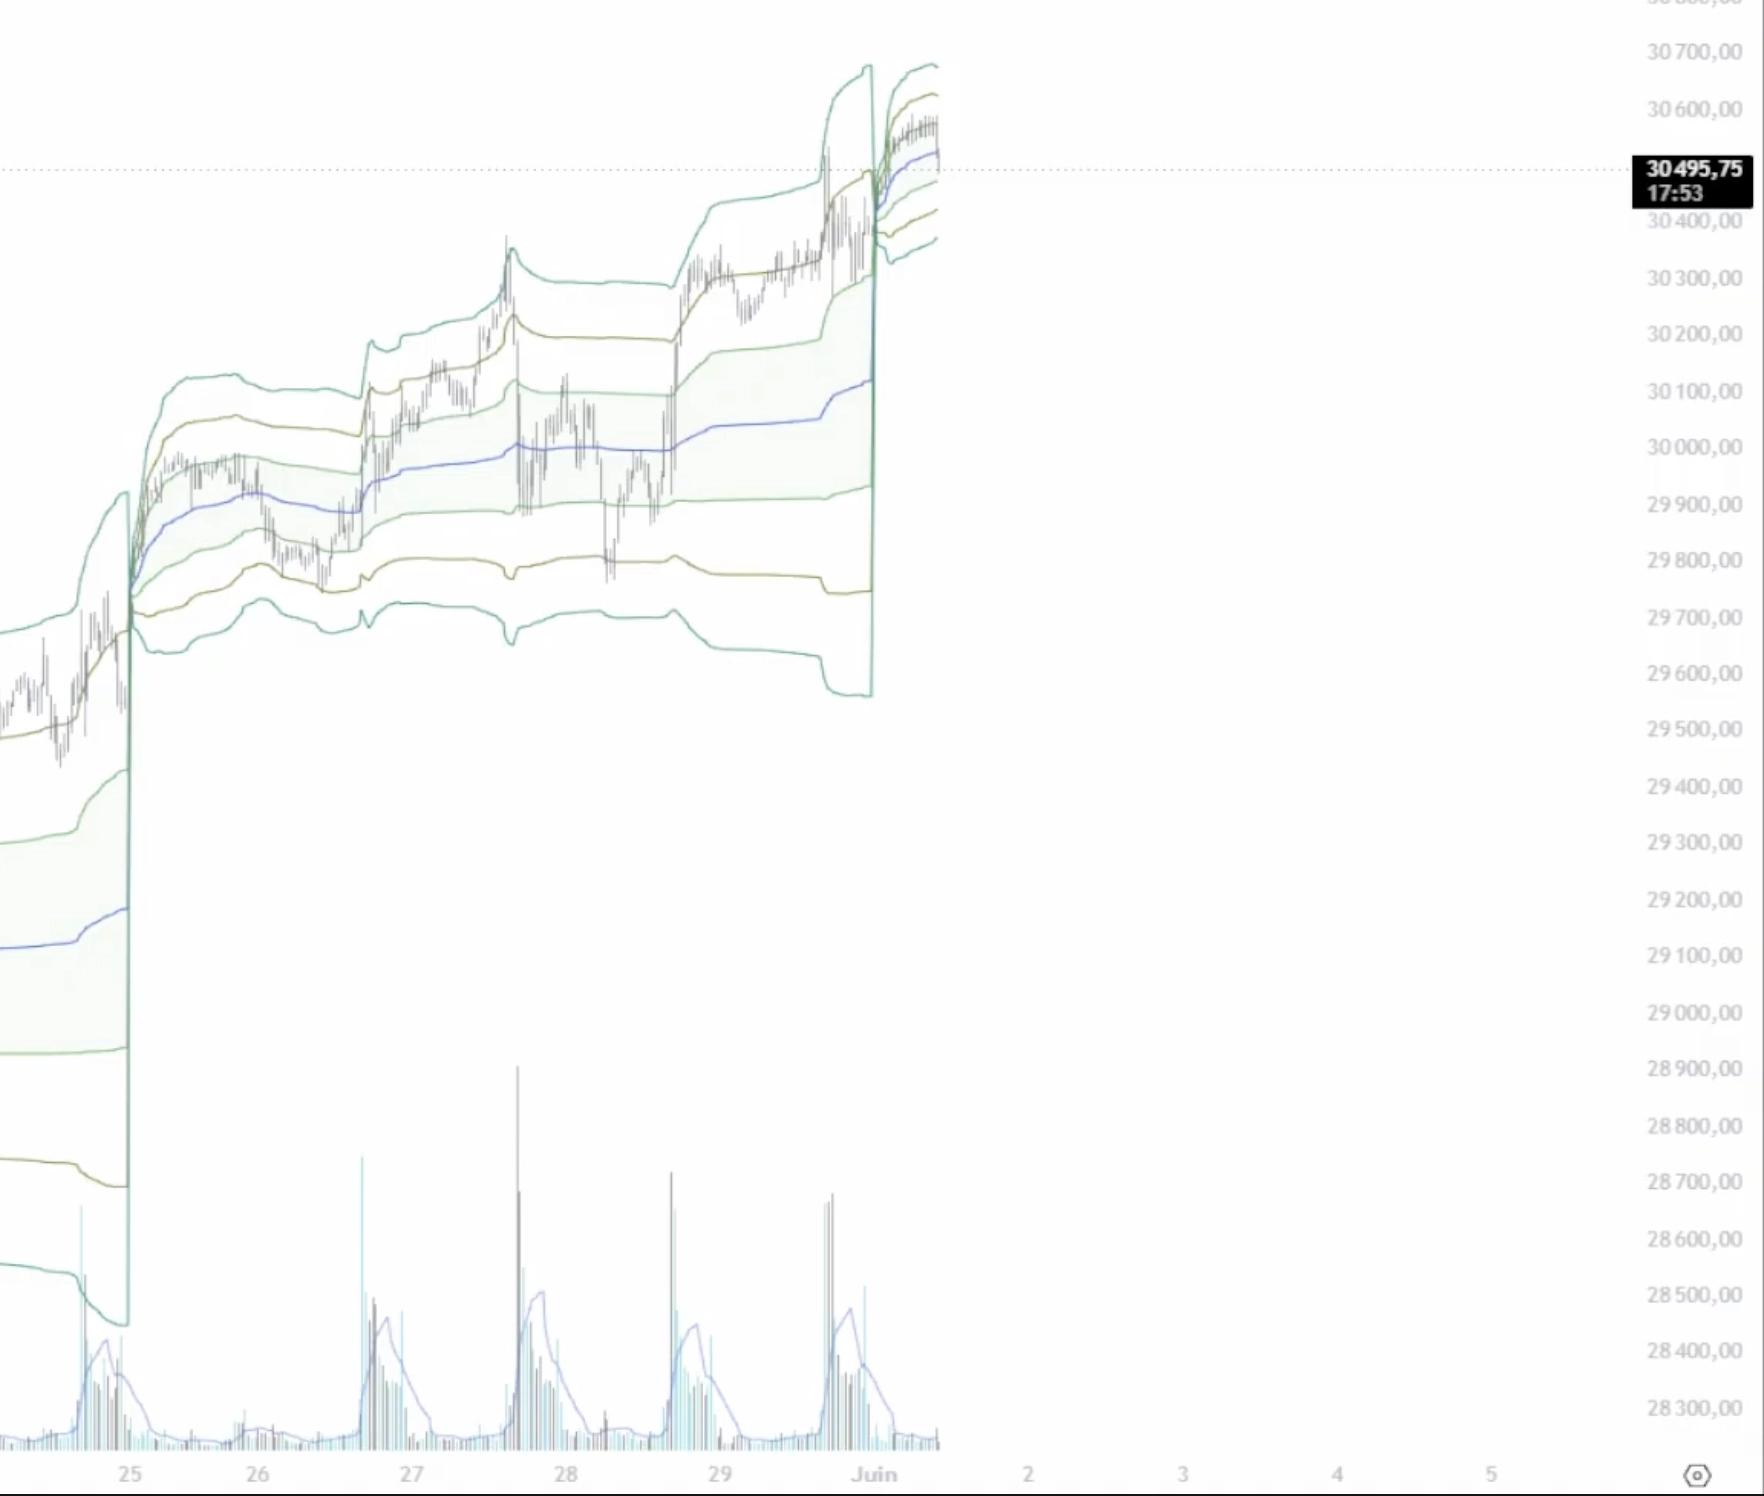
That uncertainty is why I’m putting my longer-term plans aside.
I also note that Nasdaq has become stronger than the S&P, making it my preferred instrument for swing trading.
For intraday trading, though, I’ll lean towards the S&P.
In both cases, the strategy stays the same: smaller position sizes, quick profit-taking and short-term opportunities in the direction of momentum, which is currently bullish on the daily chart.
Gold
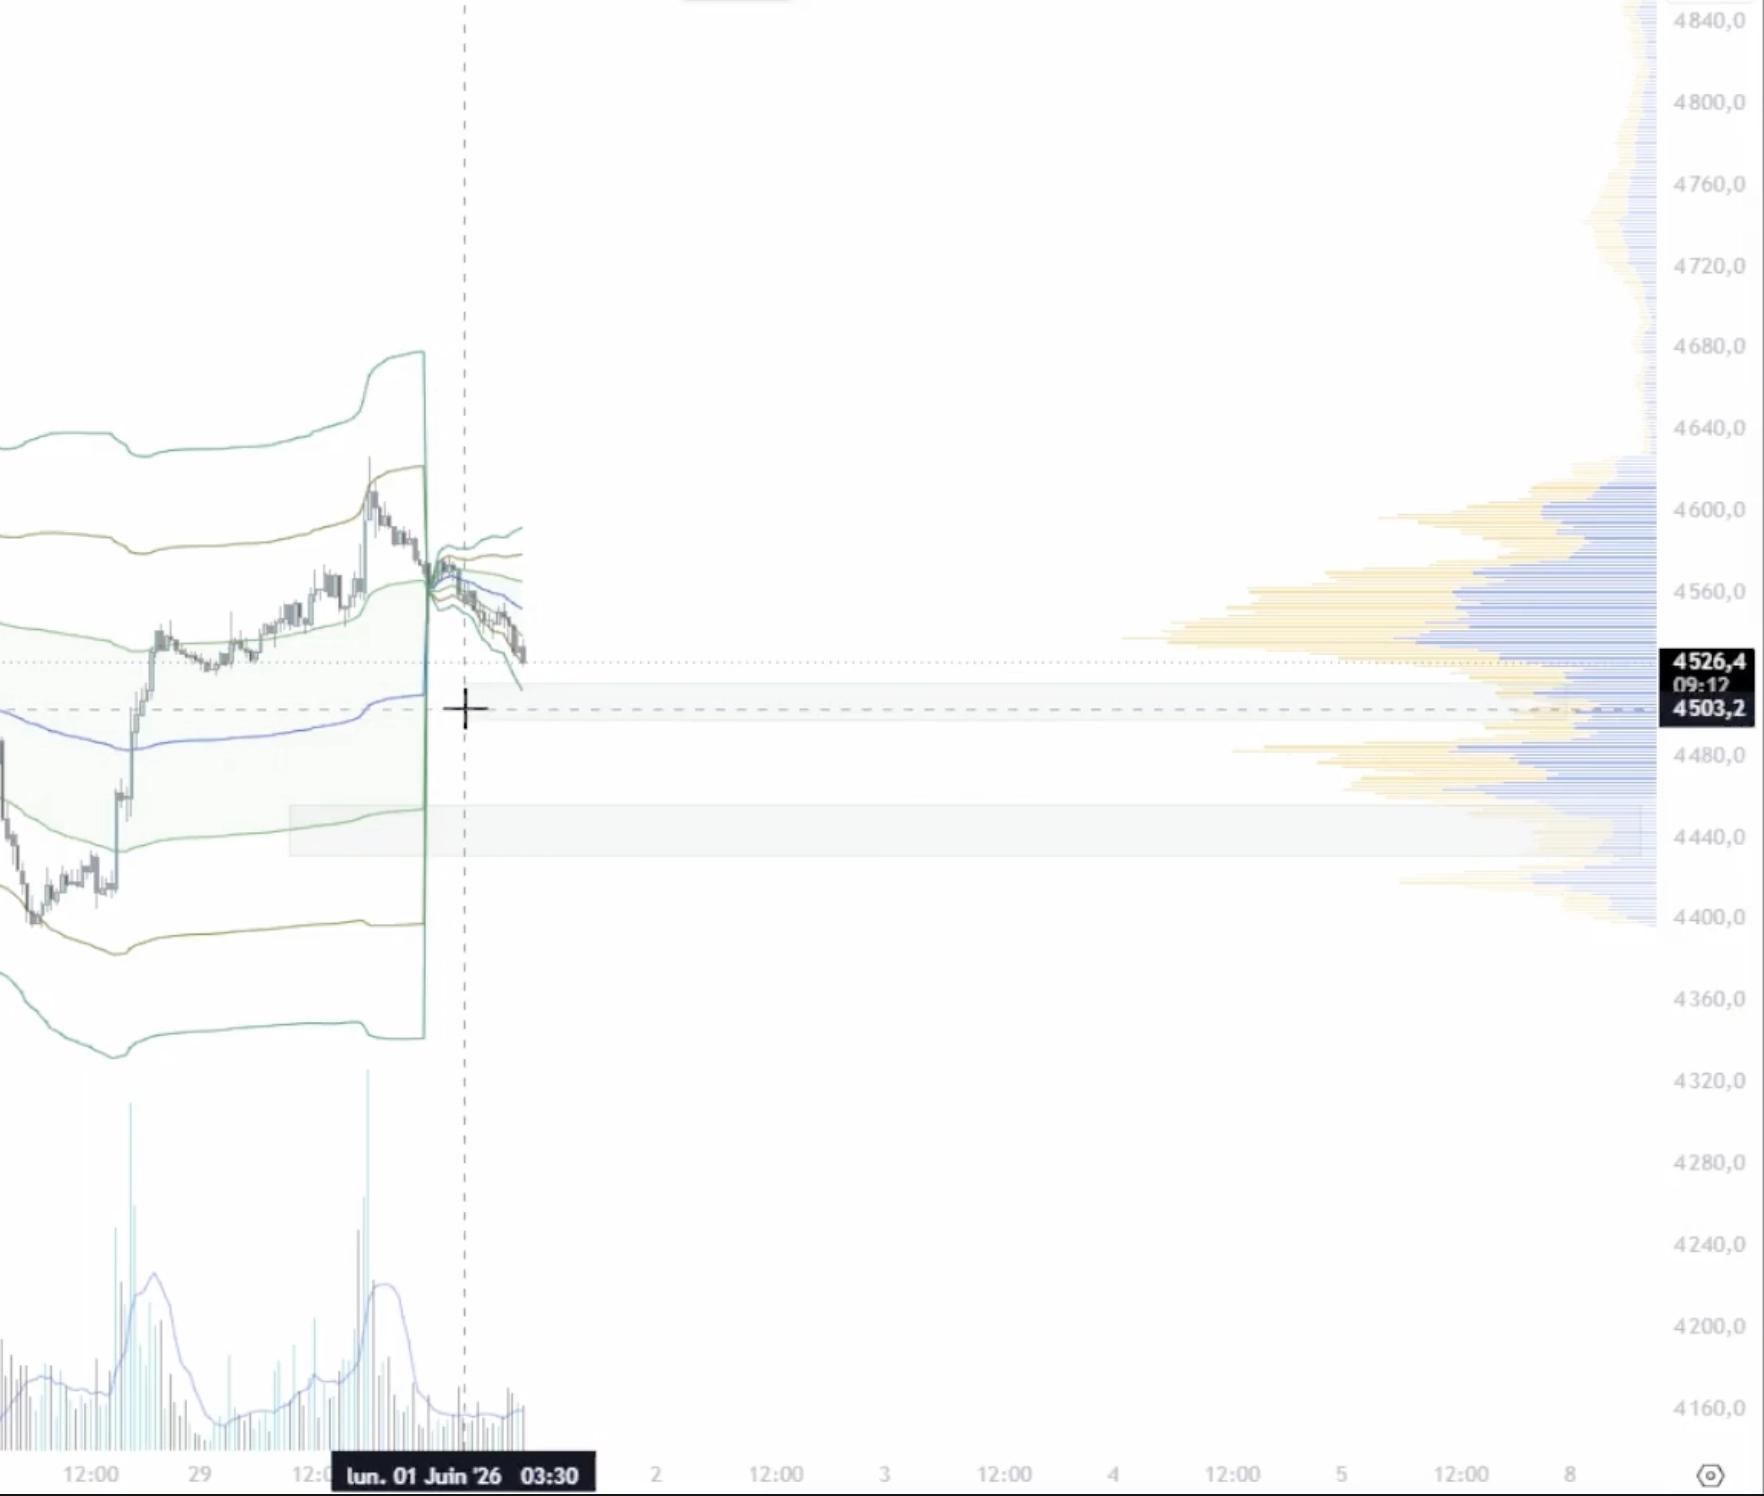
Last week, price broke a key buying zone on 27 May and kept falling.
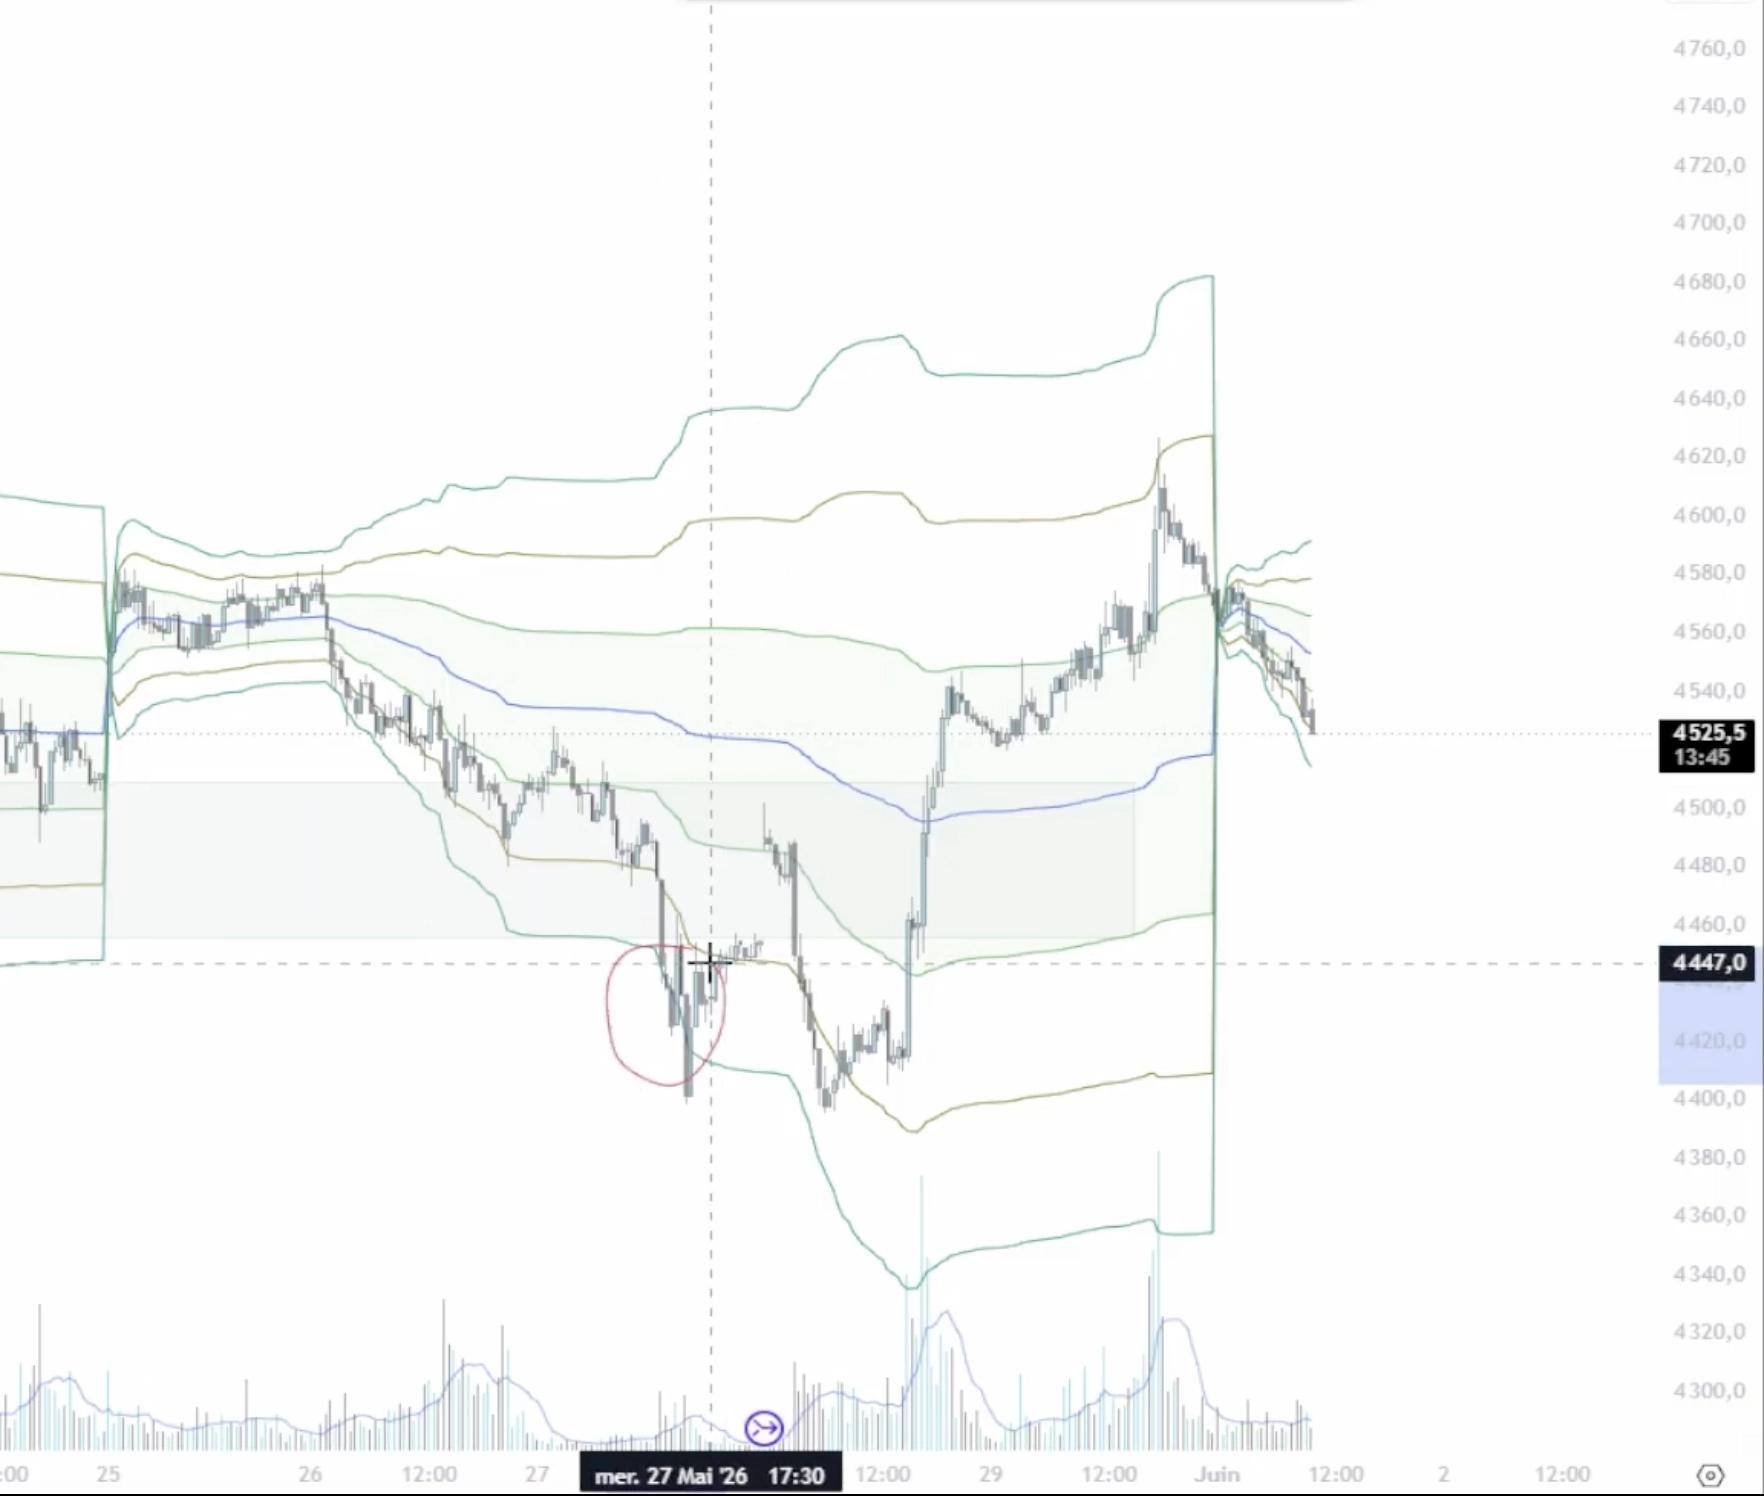
On 28 May at 14:30, a major news release triggered a strong directional move, what I call an I-shape, before bringing price straight back into the balance area identified two weeks earlier.
So we’re back to last week’s setup: trading the extremes of that balance area.
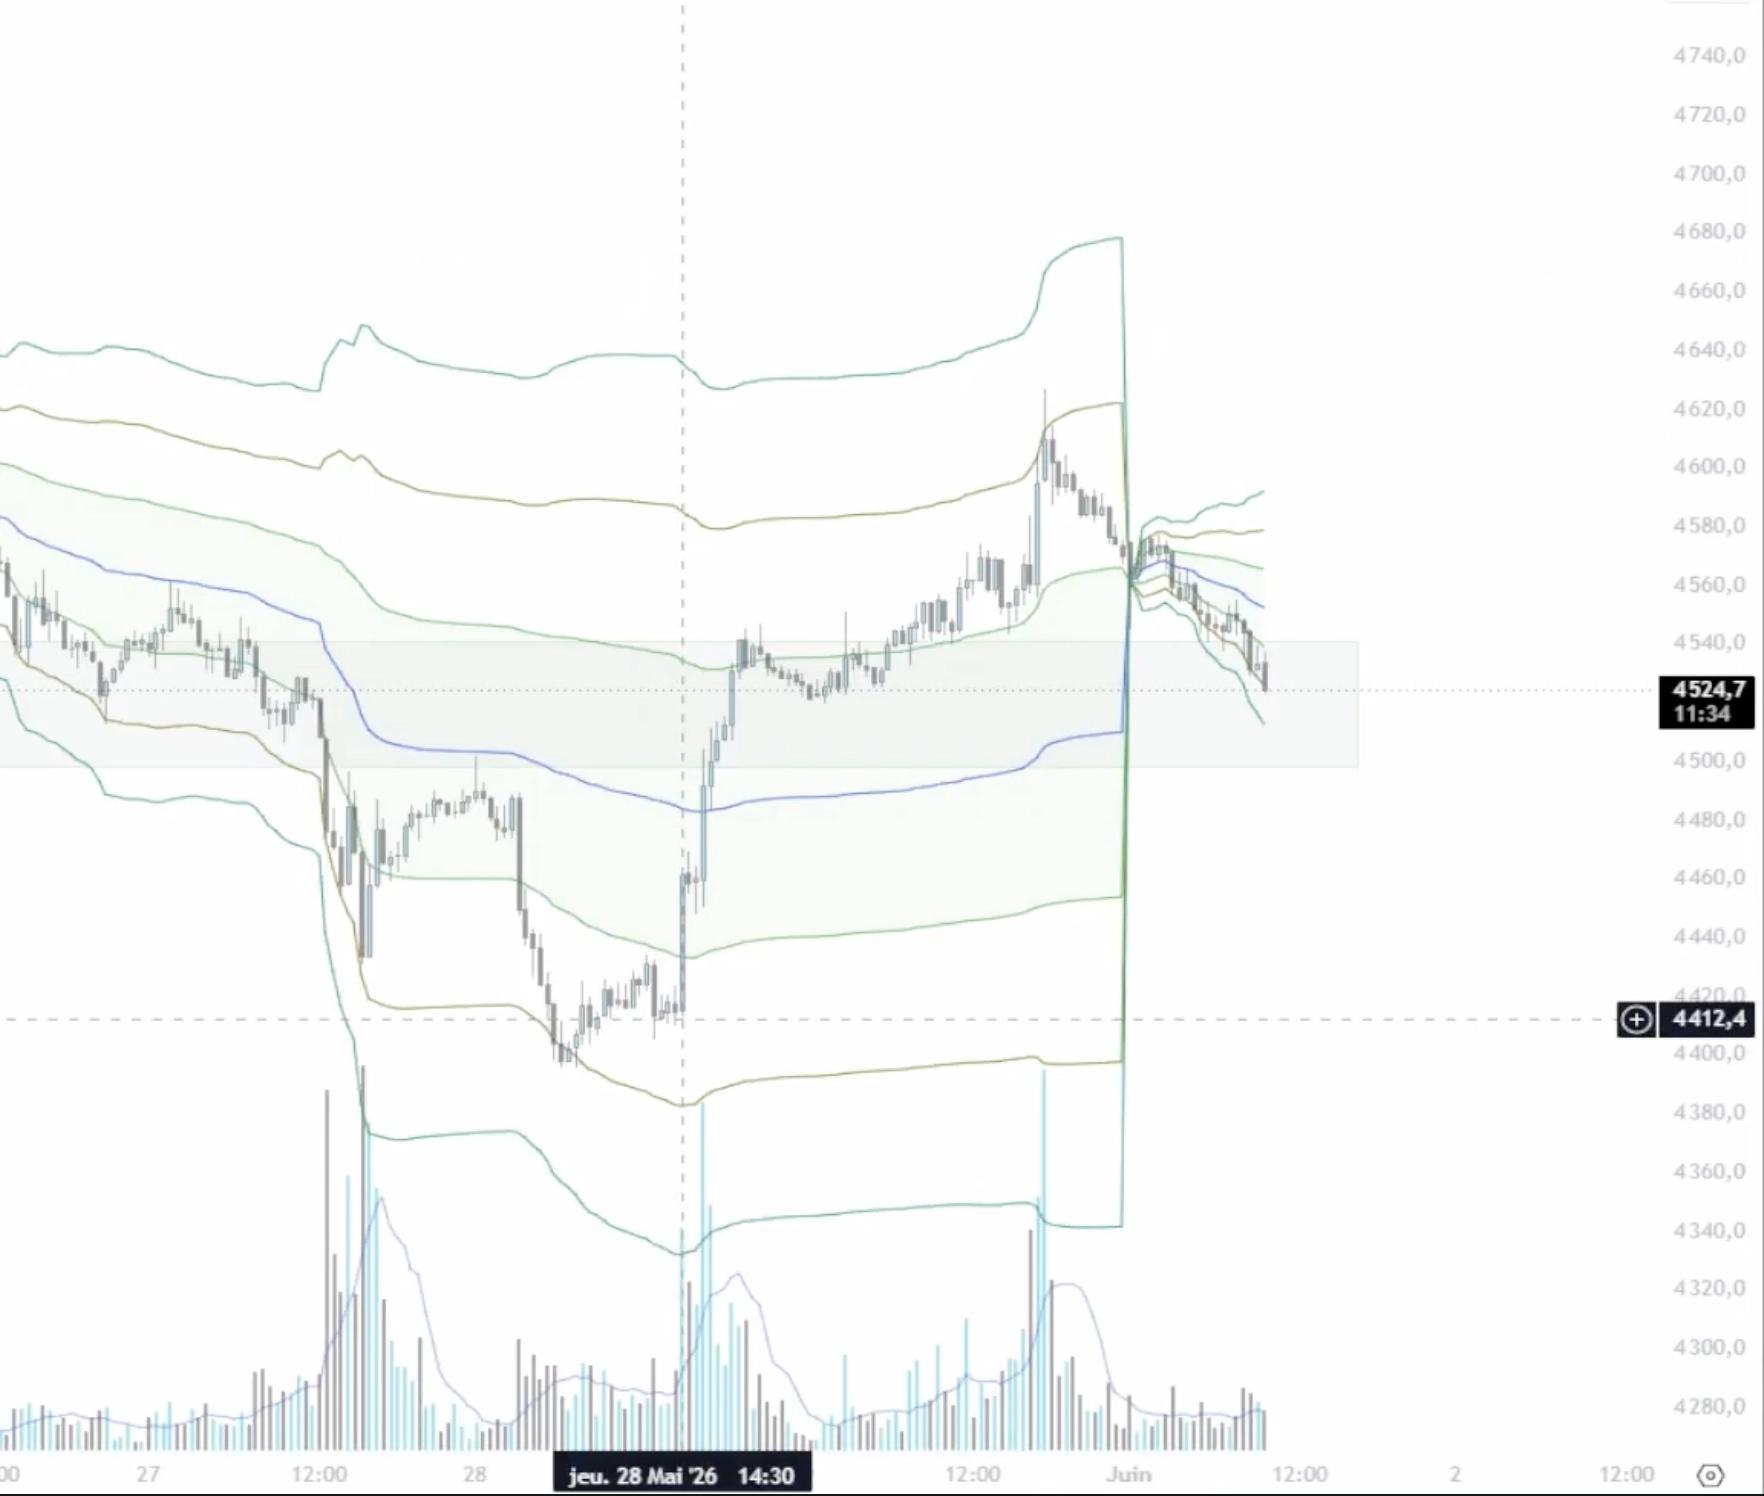
Intraday, I’ll look for entries at those extremes, taking profits at nearby levels towards the centre of the area.
Longer-term opportunities will appear once price moves significantly away from that balance.
Oil
Oil’s bounce towards VWAP wasn’t enough to change the structure.
The market quickly resumed its downward momentum, continuing the move we’ve seen for several weeks.
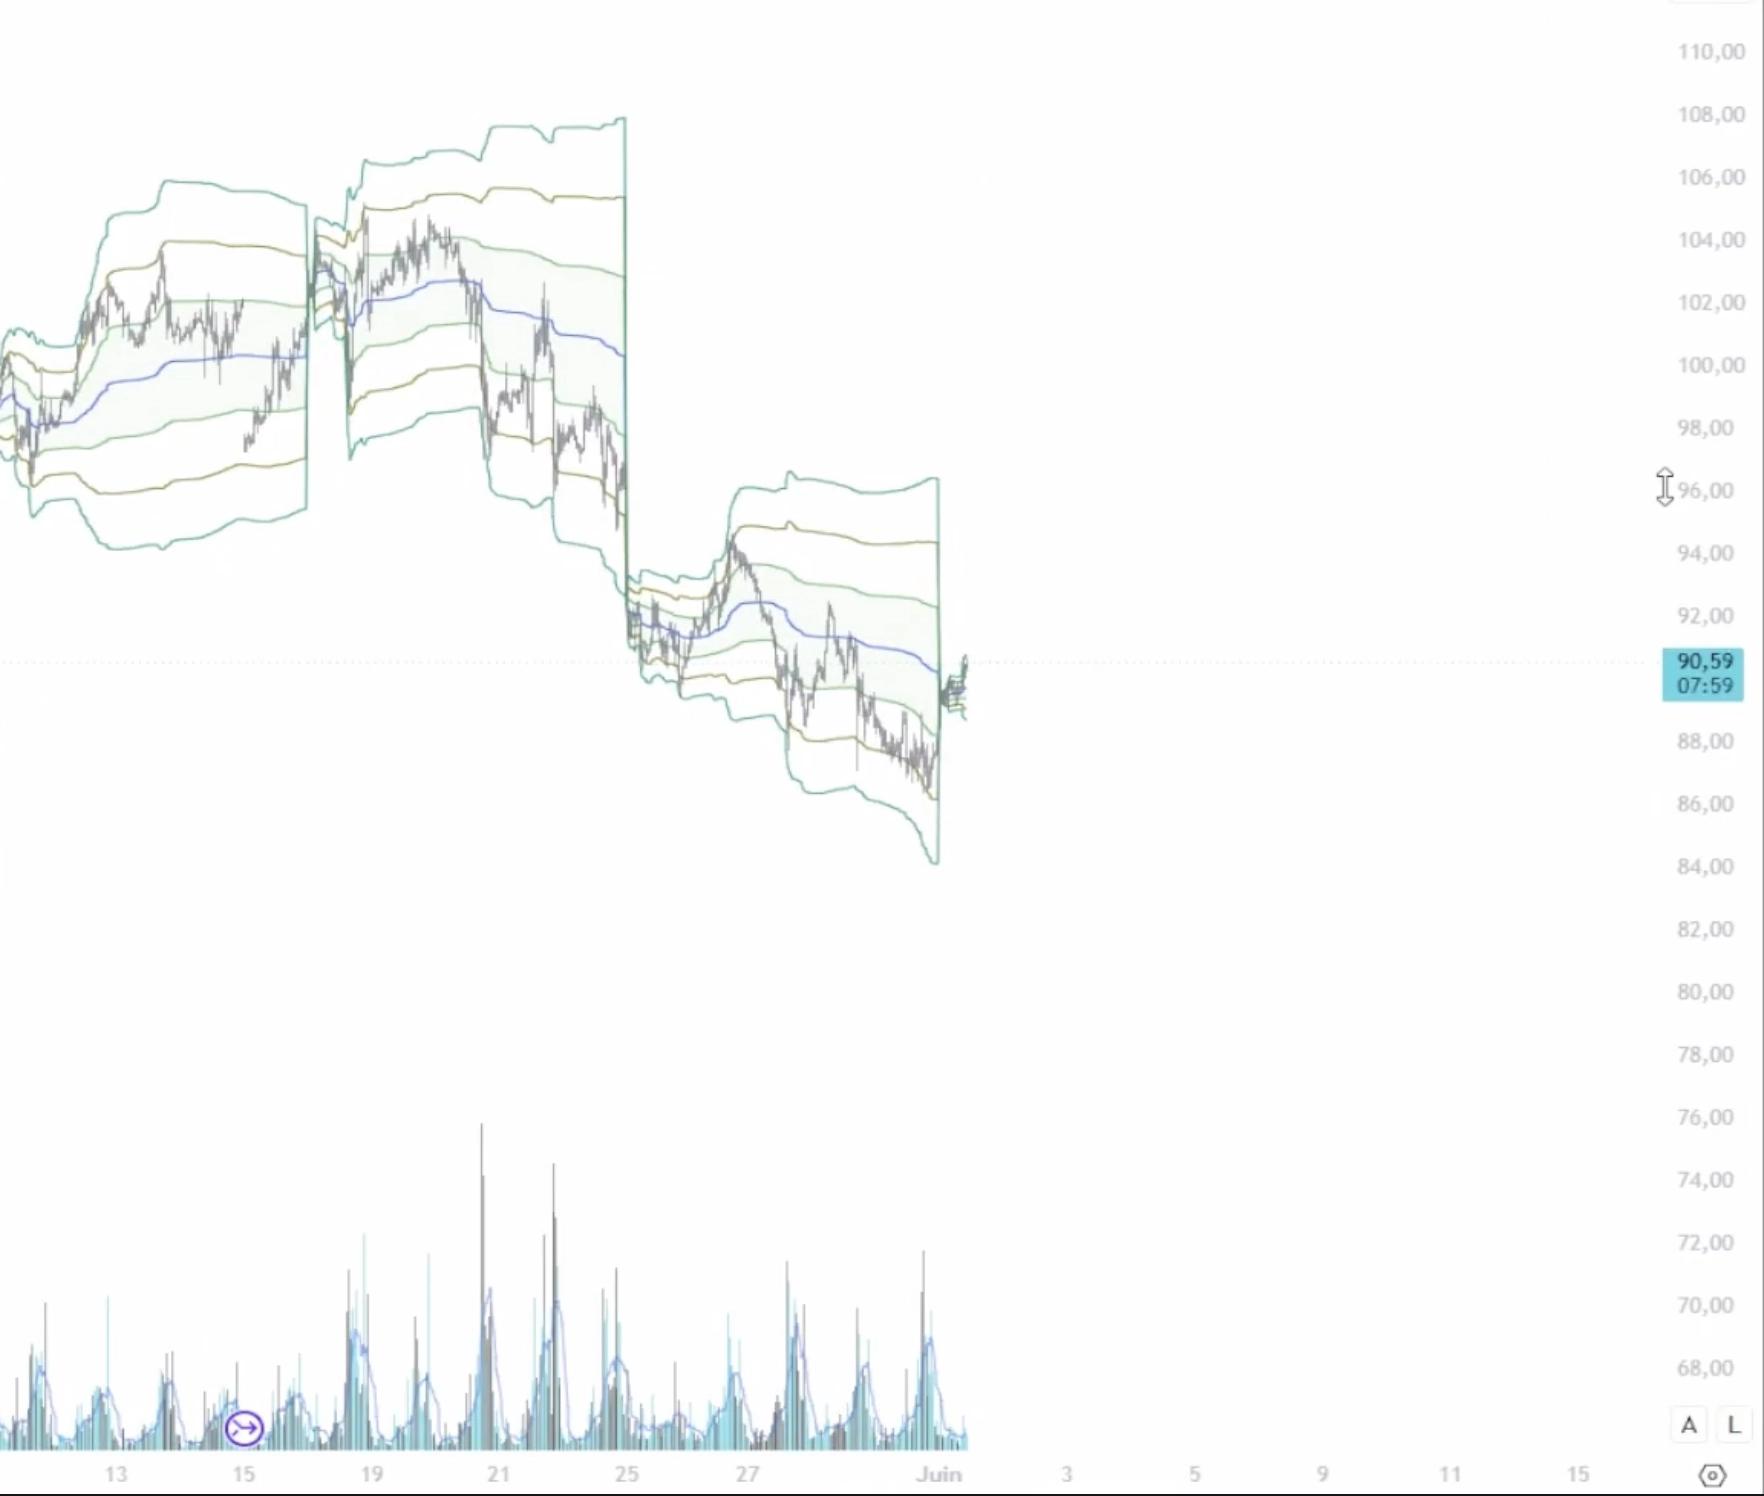
We’re now returning to levels I’d describe as "more reasonable".
VIX
The VIX keeps falling and is now around 16 to 17.
Markets are at all-time highs, with less volume and less fear.
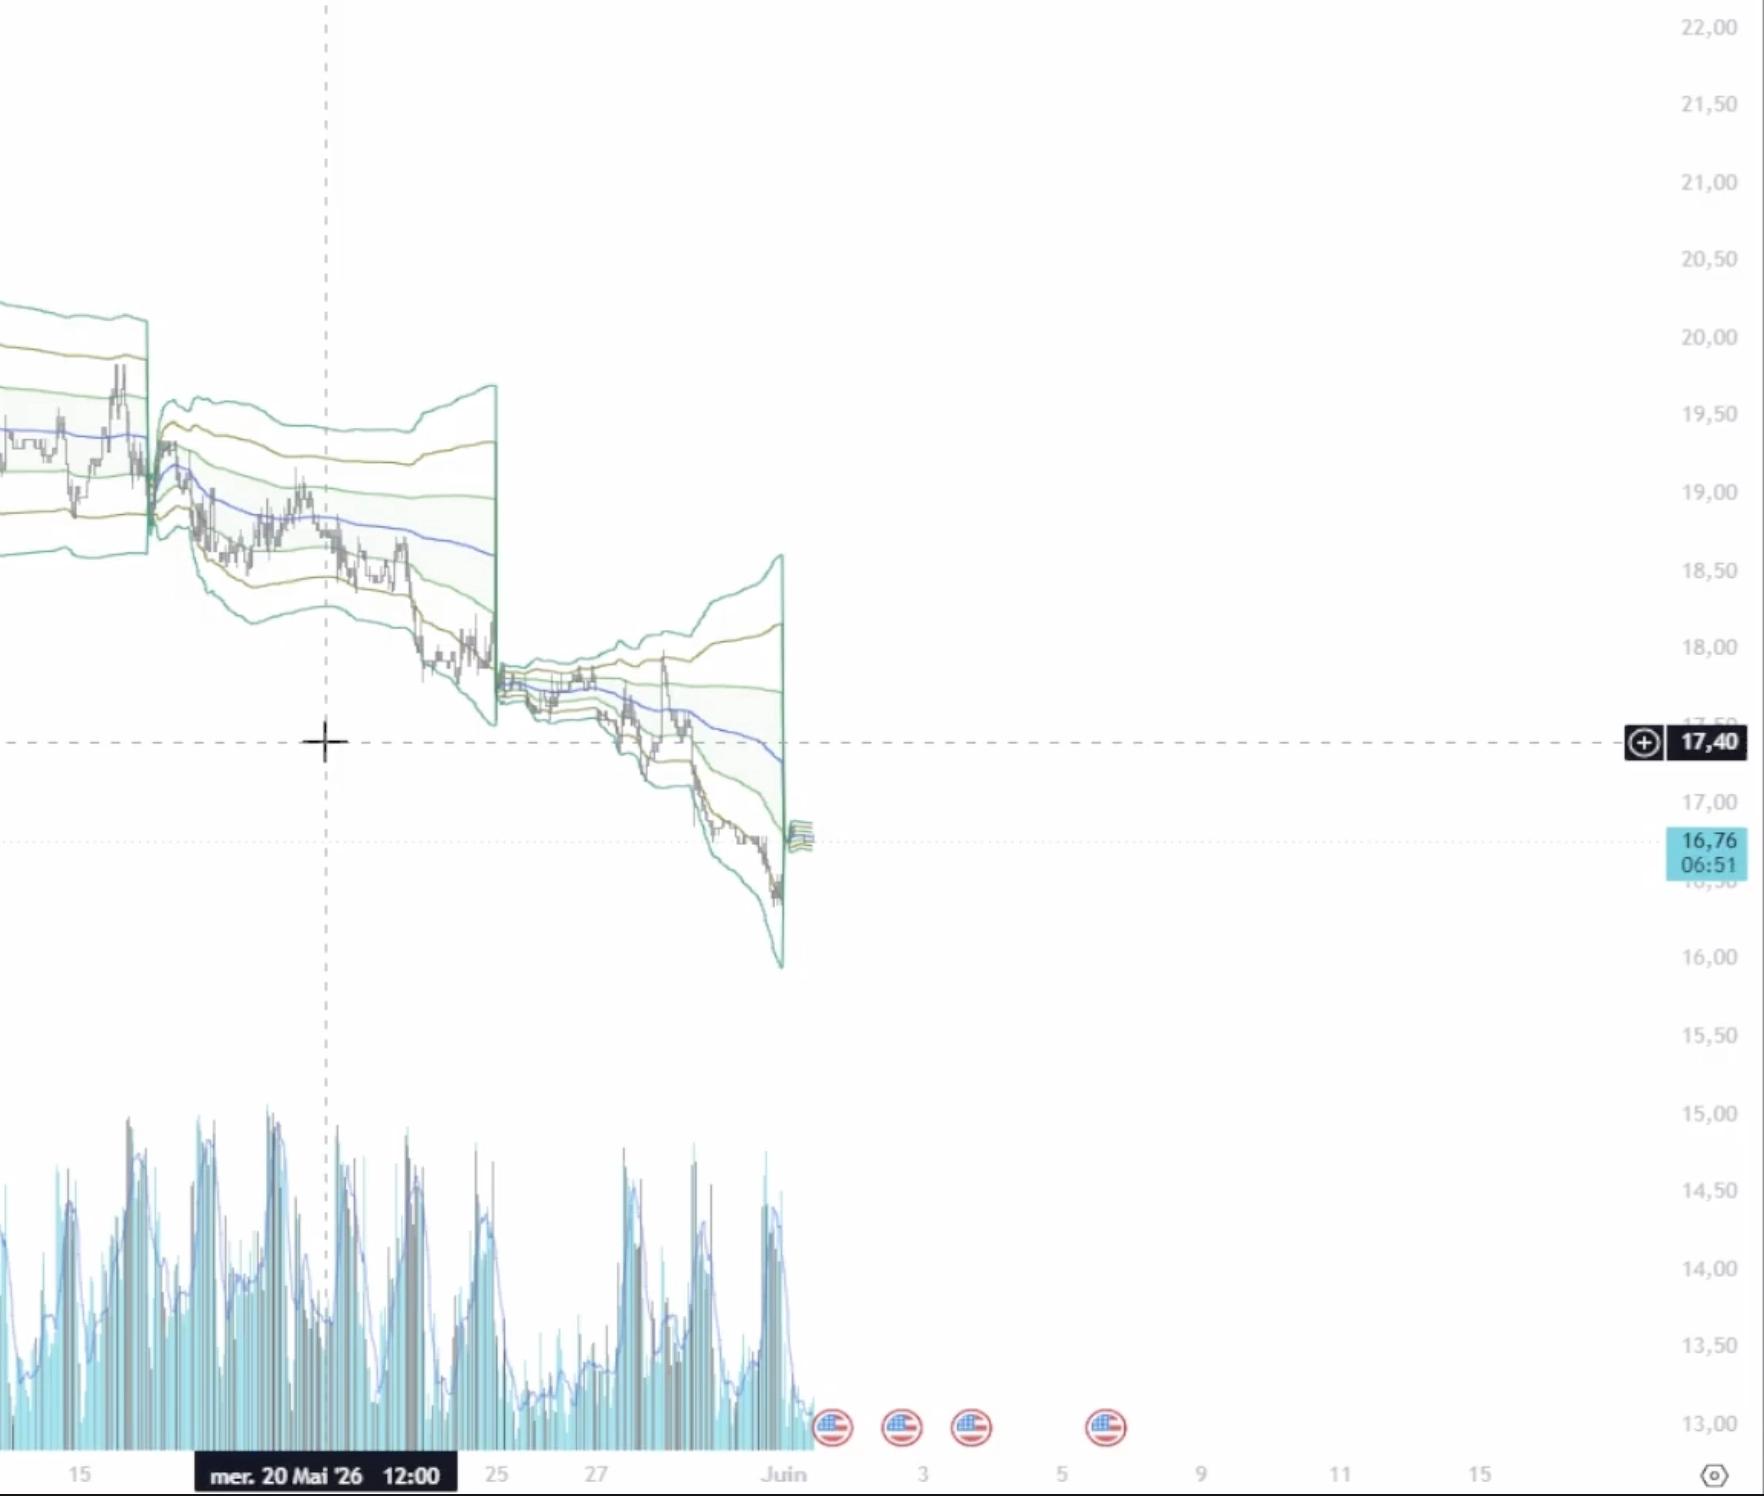
The VIX is often called the fear gauge.
It’s very low here, not because everything is fine, but because prices are so high that fewer people are active. For now, there’s less appetite to invest or unload positions.
Disclaimer: this is not investment advice. I’m only sharing my analysis.