

S&P 500
My S&P 500 analysis hasn’t changed much since last week.
The buying zone I liked was lower, but price never came back to it.
Buyers quickly stepped in on every short-term pullback, particularly around the second standard deviation bands.
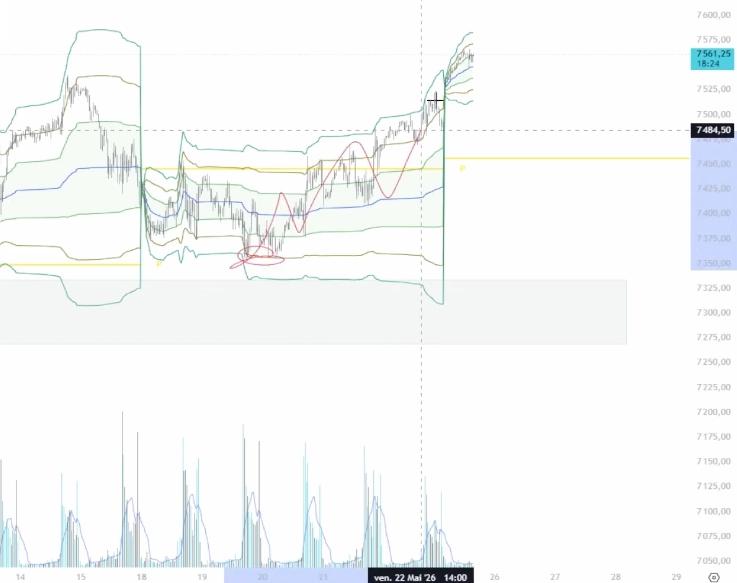
For now, that tells us the trend is still clearly bullish.
Pivot points are generally still rising, though this week they’re starting to settle within a fairly tight area.
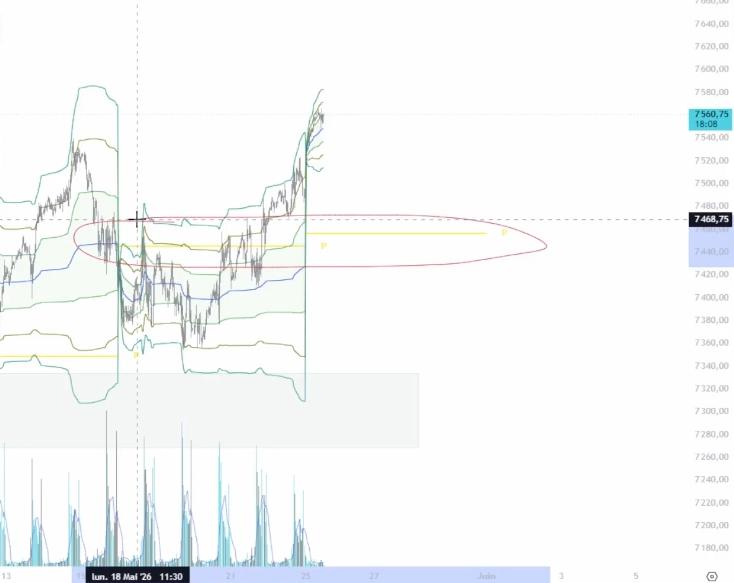
The futures contract is also at all-time highs, confirming the current strength of US indices.
The problem is that price is now very high. On Monday morning, the market opened above the previous highs.
In these conditions, I don’t want to short, but I also struggle to buy right at all-time highs.
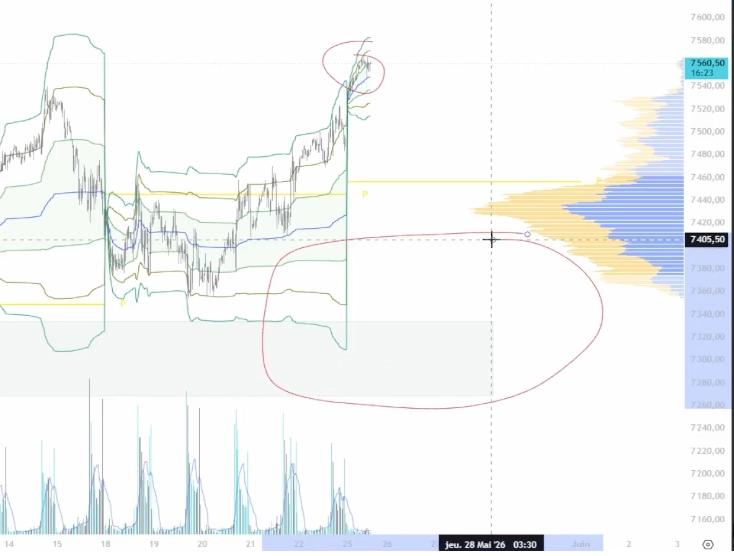
The area I’m really interested in is lower, around VWAPs, pivot points and the zones with the most volume.
The composite volume profile shows the major volume areas below current price. That’s where the market has traded most recently.
If I want to buy, I’d rather wait for a return to a more interesting zone than chase the move.
Nasdaq
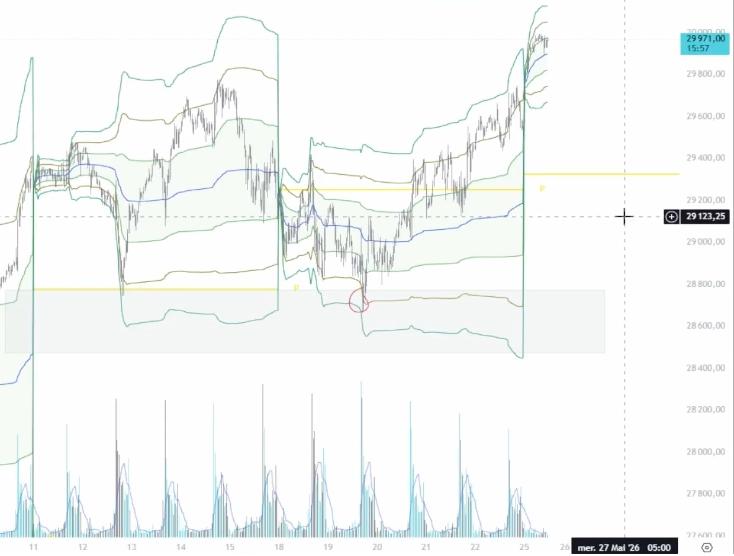
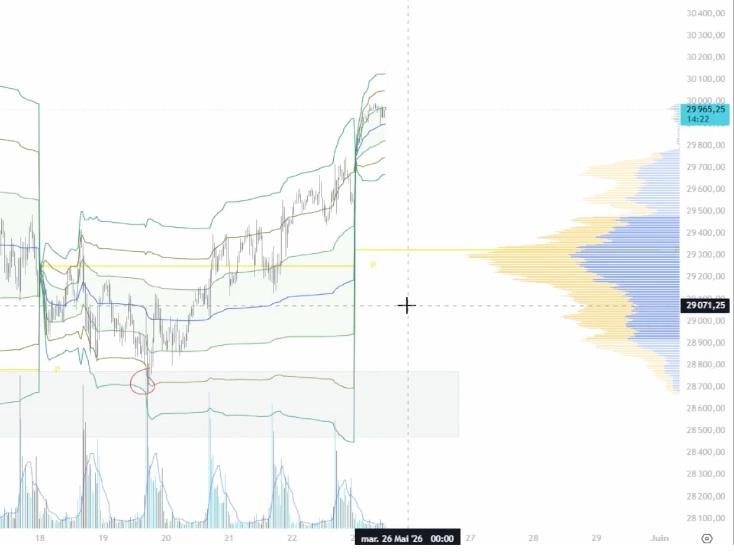
Nasdaq’s setup is similar to the S&P 500’s, with one important difference: price did return to the area I was waiting for last week.
The idea was to buy between the pivot point and VWAP.
The market reached that zone and reacted quickly. It was almost the low of the move, so the area worked perfectly.
This week, I’ll mainly look for very short-term entries with momentum, without aiming for distant targets.
If I buy at algorithmic levels, VWAPs or sensible technical zones, I’ll take profits quickly, particularly at the first standard deviation bands.
I may leave a small portion running if the move continues, but I don’t want an overly ambitious plan with the market already so high.
A correction is obviously possible, especially with Nasdaq futures approaching 30,000. But I’d rather let that correction happen, then look to buy lower.
So shorting Nasdaq isn’t my plan for the week.
As with the S&P 500, the most interesting zones are lower.
Gold
Last week’s gold zones worked well.
The idea was to buy the extremes, and the market reacted exactly there.
Each time price reached an extreme, it returned towards the balance area.
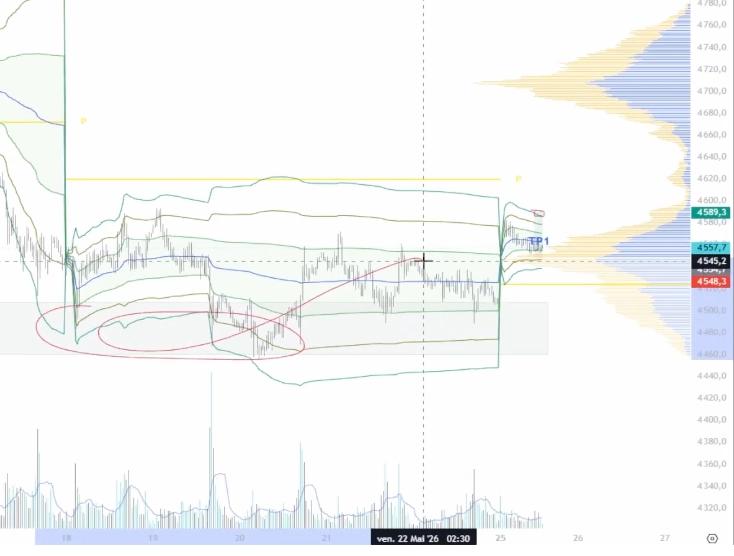
For now, the plan stays the same: trade the extremes, both long and short, while this structure holds.
The 4,500 spot level remains important. As long as gold doesn’t break it too decisively, buying the lower extremes remains an option.
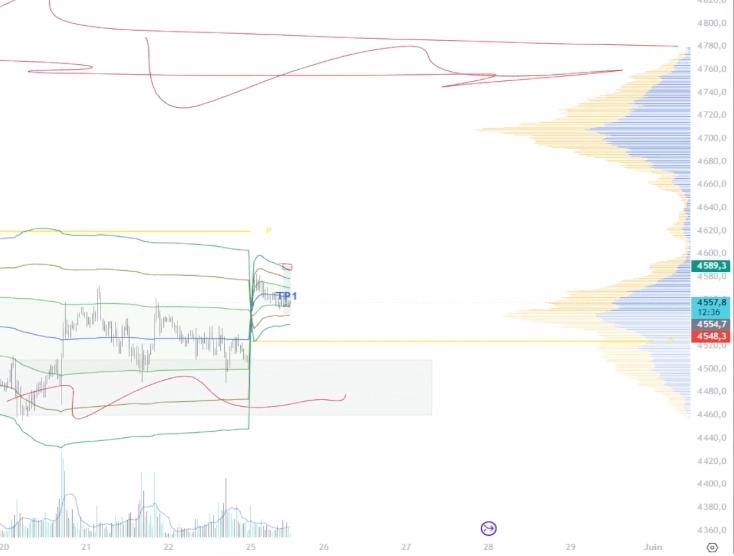
But if price moves clearly below 4,500, I’ll probably forget about longs for the week.
Bitcoin
No major change in Bitcoin.
Sellers were very active around 81,000 last week. That’s why I thought Bitcoin might struggle to hold above it.
A return towards 70,000 to 71,000 is still possible.
The decline started late in the week, but the market recovered quickly.
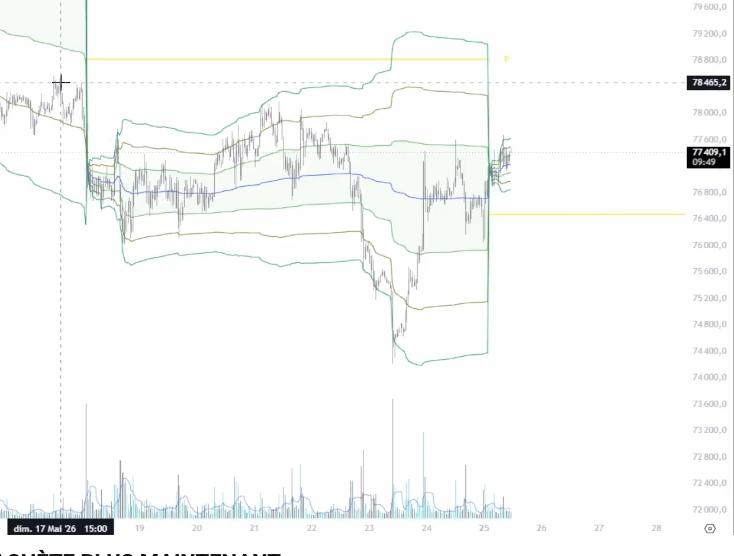
Price is now returning to an important area near the recent lows from the week of 16 May.
80,000 remains the level to watch.
Several things meet there: the pivot point, weekly VWAP and the round number of 80,000.
That makes it a zone that could determine what happens next.
For now, I’m not changing my plan. The zones are the same, and the market hasn’t given enough new information to justify a completely different analysis.
VIX
The VIX has fallen a lot, but that isn’t surprising.
US indices are at all-time highs, so fear is easing and volatility is settling.
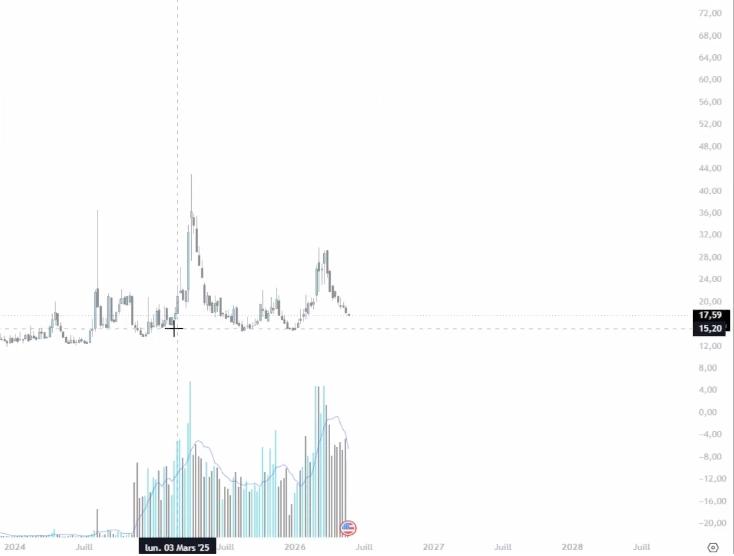
A reminder: the VIX measures expected volatility on the S&P 500.
- When it rises, it generally signals a more unstable market
- When it falls, it suggests tensions are easing
Recent weeks have brought several sources of tension, including Trump’s tariffs on China and conflict in the Middle East.
For now, the market is returning to more usual levels, around 15 to 17.
Disclaimer: this is not investment advice. I’m only sharing my analysis.