
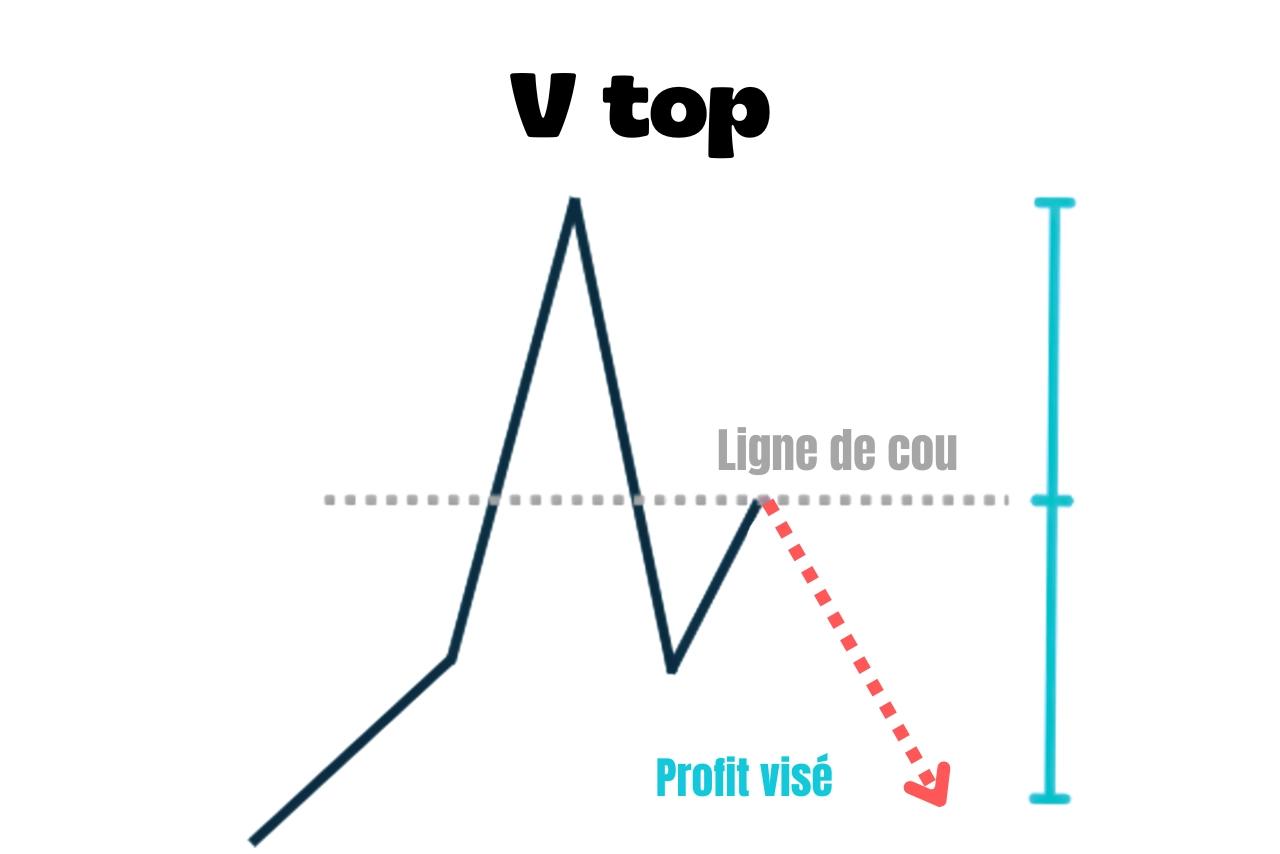
A V top is a bearish reversal chart pattern.
Like its opposite, the V bottom, it tends to appear after economic news. Price overreacts positively to the news, then ends up falling again.
✅
Price rises sharply, then falls just as sharply, drawing an upside-down V on the chart.
How do you recognise a V top?
- Price rises strongly to a high, then falls at a similar angle, forming an inverted V
- The two sides of the inverted V have similar angles
- Price breaks below the neckline, briefly returns to it in a pullback, then continues lower
⚠️
Don't confuse it with a double top, where the high is tested twice.
Here, it's tested only once.
How do you trade it?
There are two ways to enter: as soon as a candle closes below the neckline, or after waiting for price to rise back and retest it before moving lower again.
The stop-loss goes above the V's high.
For the take-profit, measure the V's height and project it below the neckline.
