
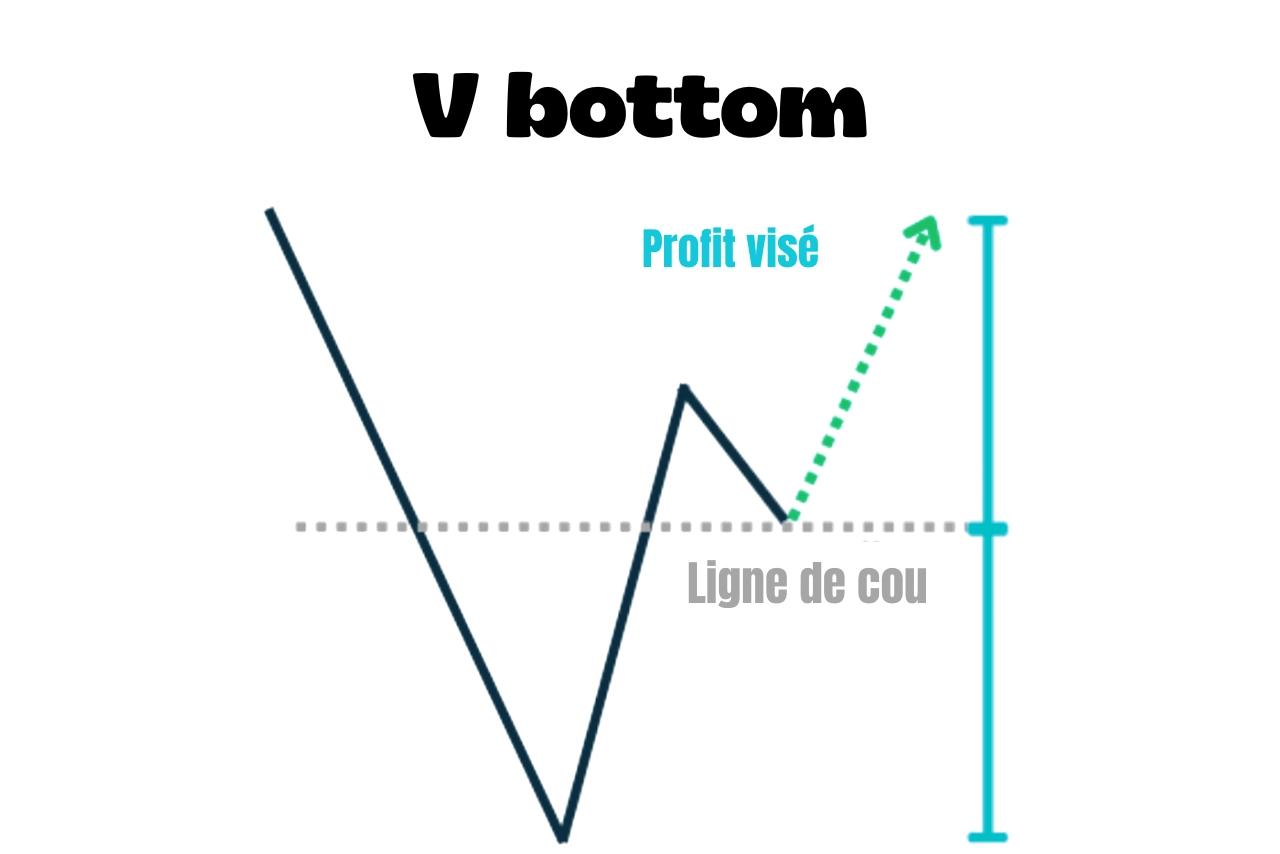
A V bottom is a bullish reversal chart pattern.
It forms when price falls sharply, then recovers with the same intensity, drawing a V on the chart.
✅
The pattern tends to appear after economic news, when price overreacts negatively before recovering.
How do you recognise it?
- Price falls sharply to a low, then recovers at a similar angle to form a V
- Both sides of the V have similar angles
- Price breaks above the neckline, may briefly retest it in a pullback, then continues higher
⚠️
Unlike a double bottom, price doesn't return to test the low a second time.
How do you trade a V bottom?
There are two ways to enter:
- Enter as soon as price breaks above the neckline
- Or wait for it to return and retest the neckline before moving higher again
The stop-loss can go below the V's low.
For the take-profit, measure the V's height and project it above the neckline.
Note: the pattern also has an opposite version, the V top.
