
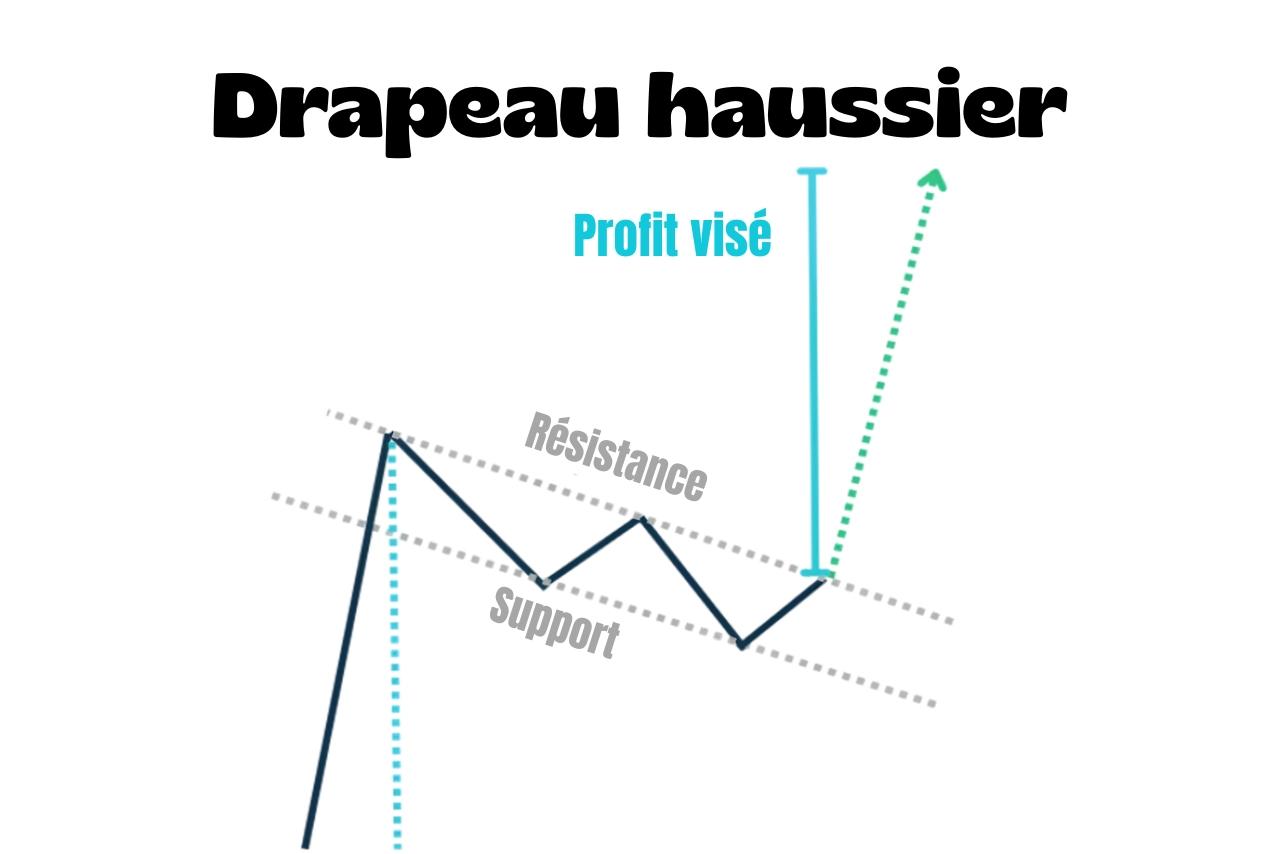
A bull flag is a bullish continuation chart pattern.
✅
It forms after a strong rise, when price enters a short consolidation before a possible resumption of the trend.
Its opposite, the bear flag, forms during a decline.
How do you recognise a bull flag?
The pattern has three elements:
- A strong rise in price that forms the pole
- A downward-sloping consolidation between resistance and support that forms the flag
- A break above the flag's resistance
The difference from a bullish pennant is the shape of the consolidation.
⚠️
In a pennant, it forms a triangle. In a flag, it forms a channel or rectangle.
How do you trade it?
The signal chart traders watch for is a break above the flag's resistance.
That's often where they look for a long entry.
The theoretical target is calculated by projecting the pole's height upwards from the breakout point.
The stop-loss usually goes below the pattern's support or the most recent low.
