
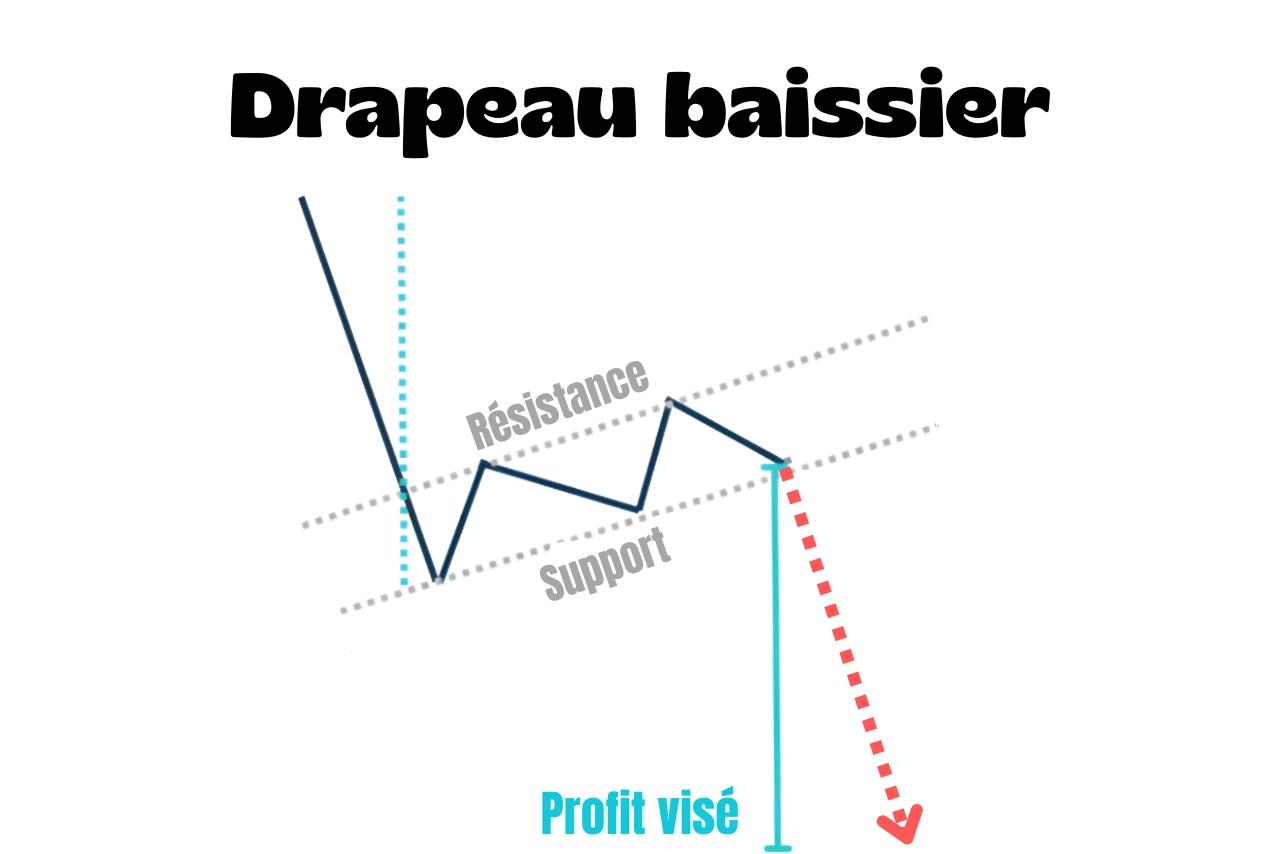
A bear flag is a bearish continuation chart pattern.
How do you recognise a bear flag?
The pattern appears in a downtrend.
It's the opposite of the bull flag, which follows the same logic in the other direction.
First, price drops sharply to form the pole.
This can be one candle or a series of consecutive bearish candles showing strong selling pressure.
✅
Next comes the consolidation, forming a flag as price rises slightly within an upward-sloping channel.
Don't confuse it with a bearish pennant, where the swings tighten into a triangle. In a flag, the channel keeps a constant width.
Price eventually breaks below the channel's support, confirming the pattern and signalling a possible resumption of the downtrend.
How do you trade it?
- The signal is a break below the channel's support, ideally confirmed by renewed volume
- Calculate the profit target by projecting the pole's height downwards from the breakout point
- Place the stop-loss above the channel's resistance or the most recent high of the consolidation
