
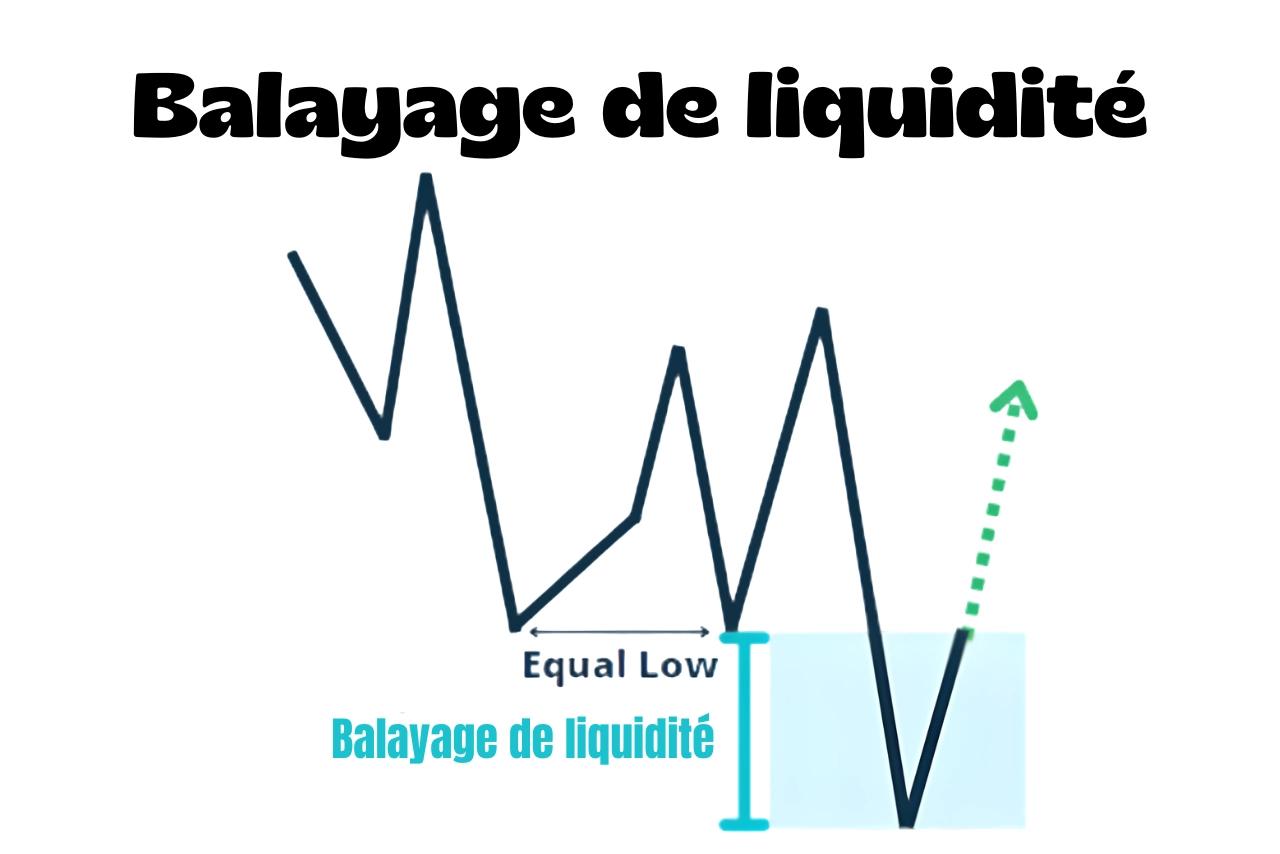
A liquidity sweep is a concept used in Smart Money Concepts (SMC) and the ICT methodology.
Unlike traditional chart patterns, it isn't a specific shape. It's a price reaction at a liquidity level.
How do you recognise it?
A liquidity sweep forms around areas where orders and liquidity naturally gather:
- Recent highs and lows
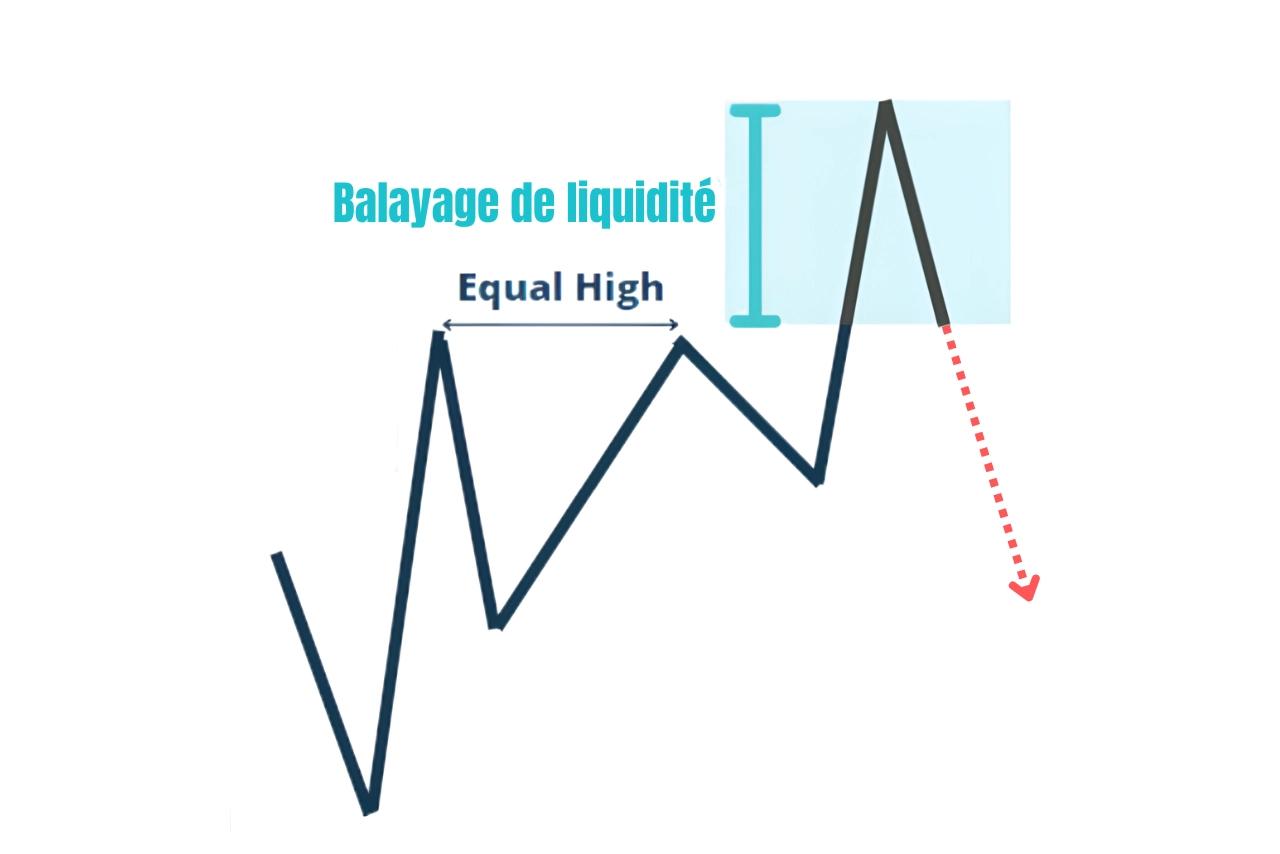
- Equal highs or equal lows
- Round psychological levels
You can recognise one when price briefly crosses one of these levels, triggers the stop-losses there, then returns to the previous area.
The move often leaves a visible wick on the chart.
There are two types, depending on the direction:
- Bullish liquidity sweep: price moves below a low, then turns upwards
- Bearish liquidity sweep: price moves above a high, then turns downwards
How do you trade a liquidity sweep?
Once the return to the previous area is confirmed, you can consider a position in the opposite direction to the initial move.
The stop-loss goes beyond the wick formed during the sweep.
The take-profit is most often placed at the opposite liquidity area.
