
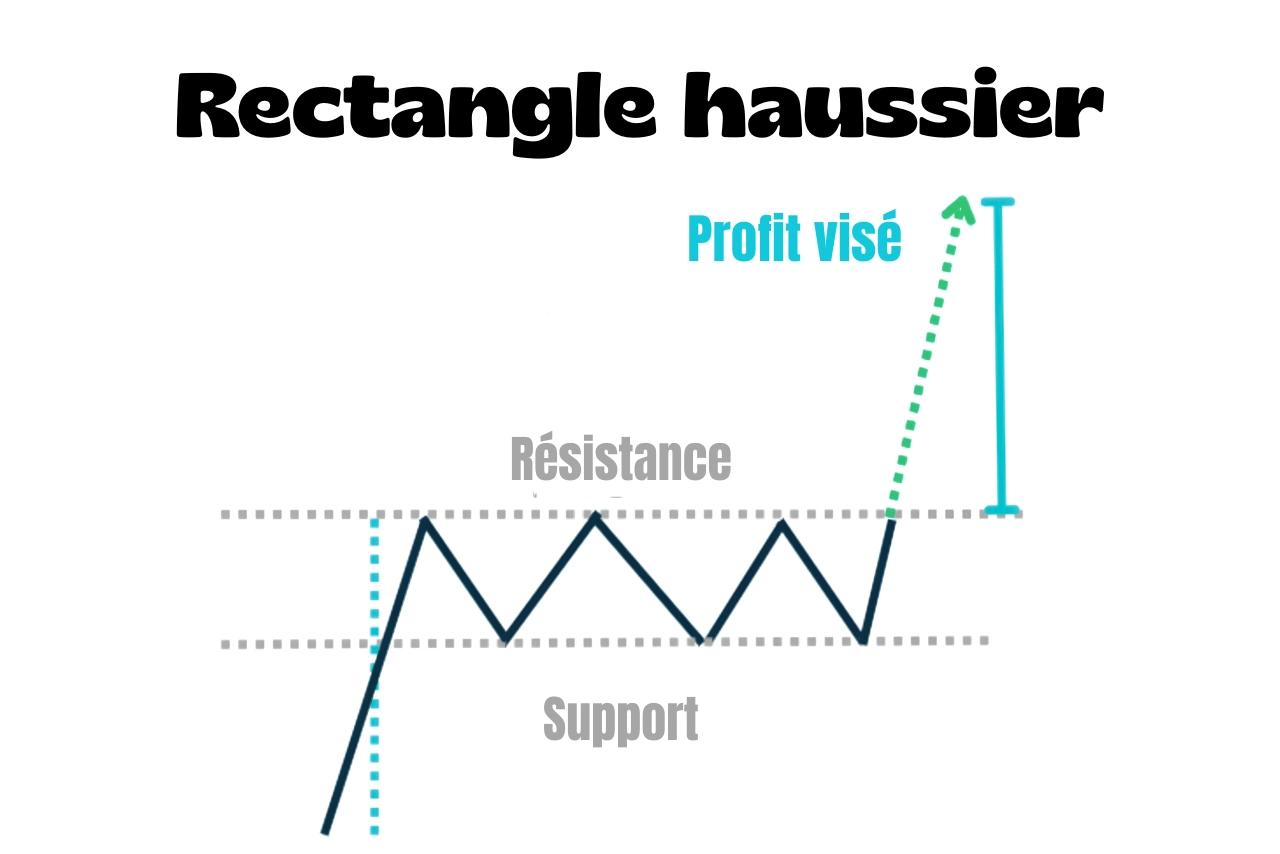
A bullish rectangle is a continuation chart pattern.
✅
It appears after a rise, when price spends some time moving between horizontal resistance and horizontal support.
The pattern is confirmed when price breaks above resistance.
It can then signal that the uptrend is resuming.
The bearish rectangle works the other way round: it forms after a decline and is confirmed by a break below support.
How do you recognise a bullish rectangle?
- The market is rising before the rectangle forms
- Price stalls below resistance several times
- Price bounces off support several times
- The structure stays horizontal throughout the consolidation
- A break above resistance confirms the signal
How do you trade it?
The buy signal appears when price breaks above resistance.
You can enter after a candle closes above that level.
The stop-loss can go below the rectangle's support.
To calculate the profit target, measure the distance between support and resistance, then project it above resistance.
