
✅
A bearish pennant is a bearish continuation chart pattern.
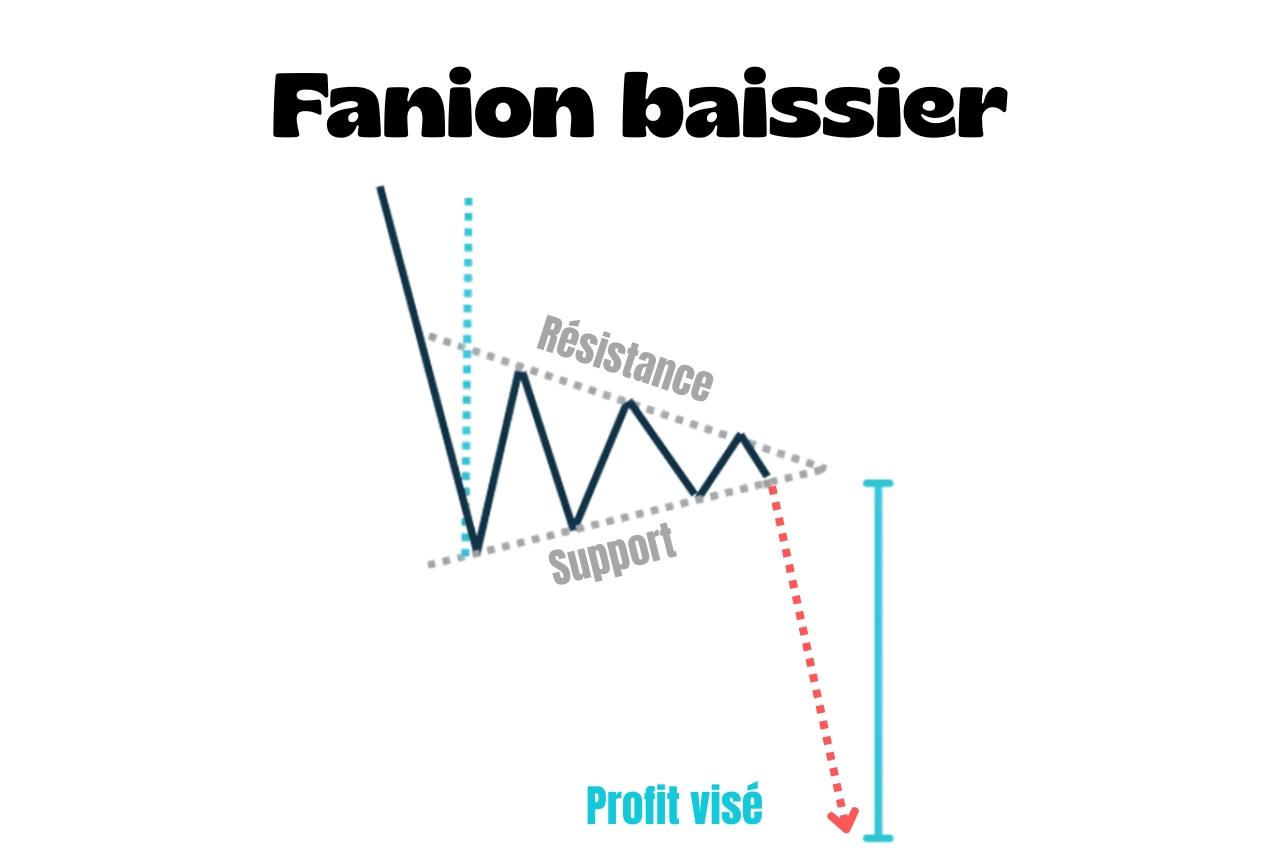
It forms when price falls sharply, then tightens into a symmetrical triangle before heading lower again.
How do you recognise a bearish pennant?
It has two parts:
- The pole: a sharp, decisive fall in price
- The pennant: a consolidation where price tightens between falling resistance and rising support, until it breaks downwards
The bullish pennant follows the opposite logic and appears as an uptrend continues.
How do you trade it?
A candle closing below the triangle's support confirms that sellers are regaining control and the decline is resuming.
This is the breakout where chart traders look for a short entry.
You can set the take-profit by projecting the height of the pole downwards from the breakout point.
The stop-loss goes above the pennant's resistance.
