
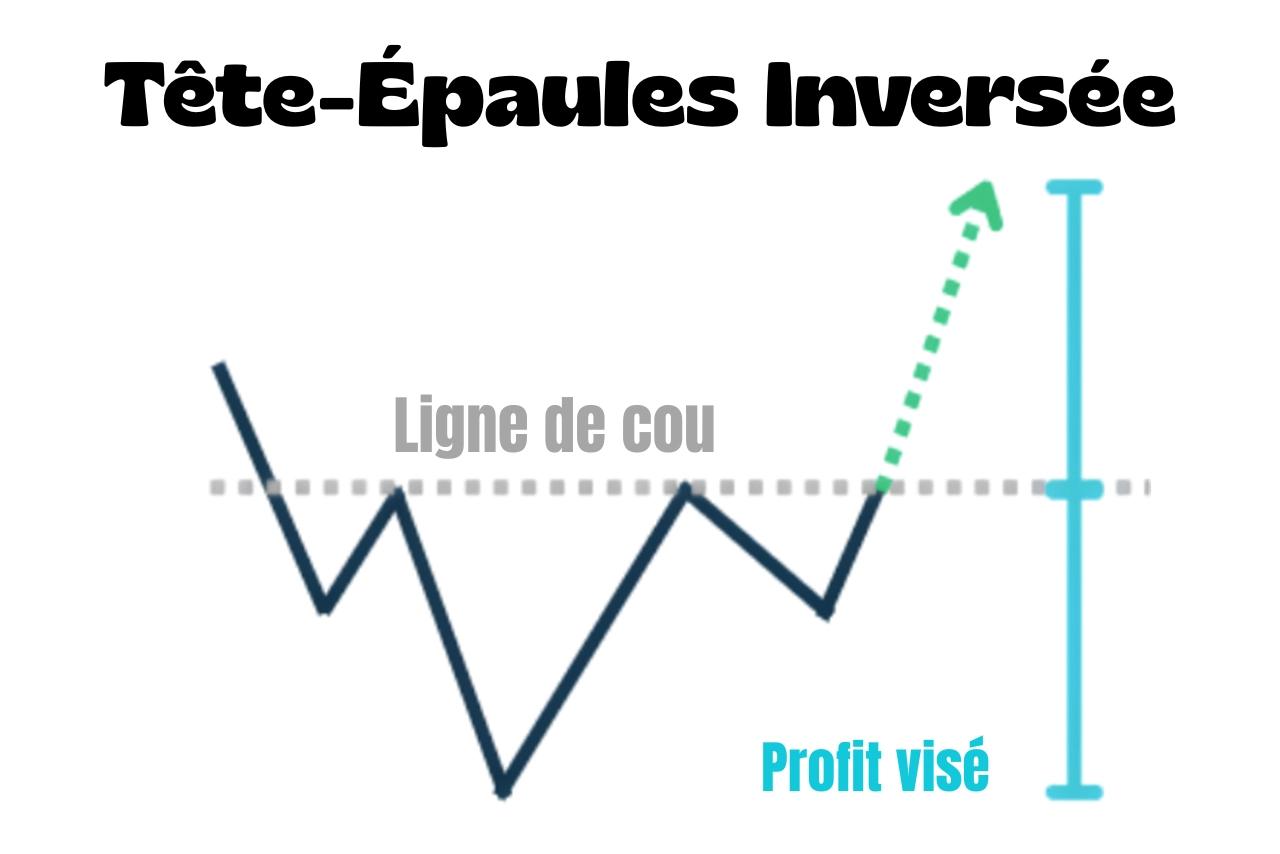
The inverse head and shoulders chart pattern usually appears after a decline.
✅
It indicates that selling pressure is weakening and buyers are gaining ground.
The pattern consists of three lows:
- The first forms the left shoulder
- The second forms the head and falls below the other two
- The third forms the right shoulder
The two rebounds between these lows form the neckline.
There is also a standard head and shoulders pattern, which signals a bearish reversal instead.
How do you trade an inverse head and shoulders?
The pattern is confirmed when price moves above the neckline after the final low.
✅
You enter long at that point and place the stop-loss below the right shoulder's low.
For the profit target, measure the distance between the head and the neckline, then project it upwards from the breakout point.
