
Keeping a trading journal and interpreting its data is essential if you take trading seriously.
I'll explain how to structure your journal, what to record and, above all, how to analyse it.
What is a trading journal for?
Contrary to what many people think, you don't keep a journal for pretty statistics or an ego boost. You keep one to improve your trading.
The reality is simple: PnL, your profits and losses, and memory alone aren't enough to help you improve.
You need concrete data to interpret your progress over time and build action plans.
Once you've collected that data, a trading journal helps you:
- Confirm what works
- Improve what works
- Filter out what doesn't work
- Eliminate weaknesses
- Preserve mental stability
Whether you're a beginner or experienced trader, a journal remains useful.
A journal as a mental stabiliser
Concrete data and a track record can ease doubts during a rough patch, or show when those doubts are justified.
For example, if my data shows an 80% win rate across 100 trades on a specific asset with a specific strategy, I won't worry if the next 3 trades go badly.
I won't question my entire approach.
But if my win rate is close to 0% across 50 trades with the same asset and strategy, I have a real reason to reassess.
What should you use for your trading journal?
The tool matters less than how you use it. Excel, Google Sheets or Notion is perfectly fine to start with.
The most important thing is to build the habit of filling it in and reviewing it regularly.
Later, you can move to a specialised tool that automates more advanced analysis.
Here's an Excel trading journal template I used for several years:
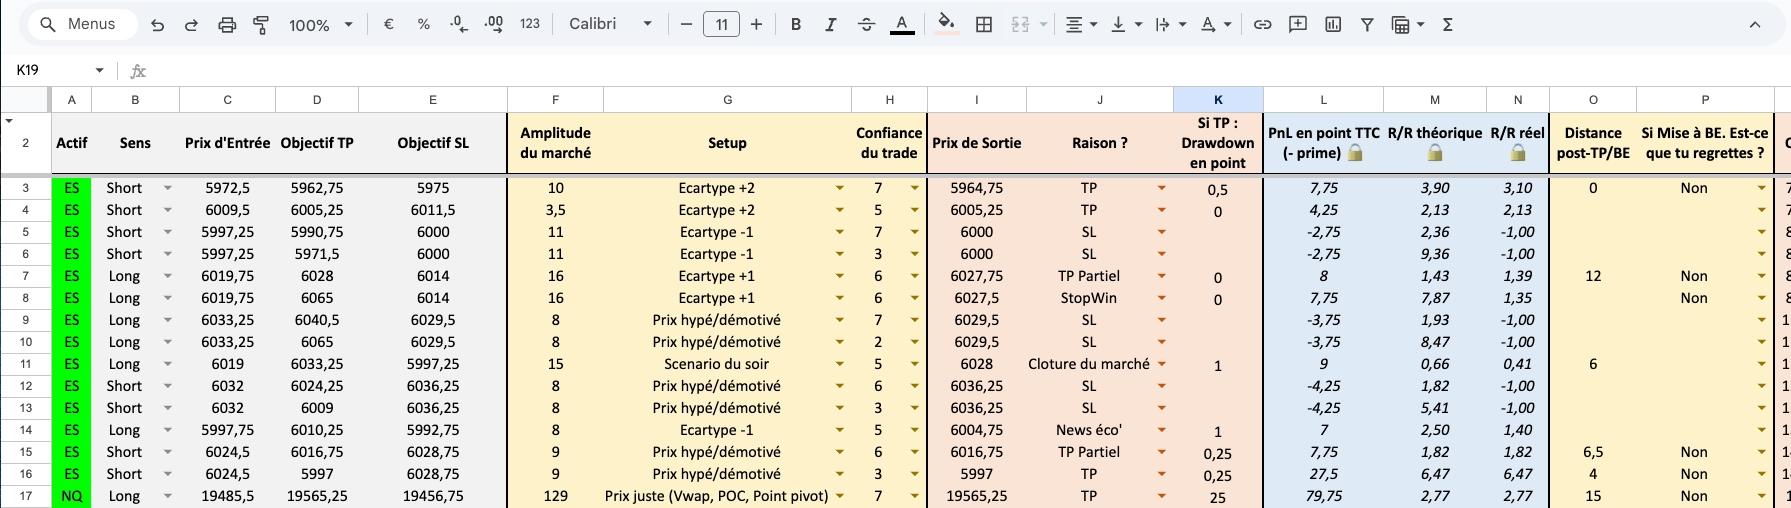
Excel's advantage is that you can customise everything.
The downside is that you have to set everything up yourself and need advanced knowledge to build pivot tables and use complex formulas.
Over time, maintaining and updating the file becomes tedious.
That's why I eventually switched to a specialised tool with the features I need.
How do you keep a trading journal?
The most important thing is being able to use the data to identify ways to improve.
I built my method around that goal, and it has proved just as effective for my students.
I'll explain it in detail below.
Collecting data in 3 stages
I record each trade in three stages:
- Before or just after entry: record the relevant information
- At exit: record the result and what happened
- That evening or the next day, once price has moved: review it in hindsight
What to collect at each stage
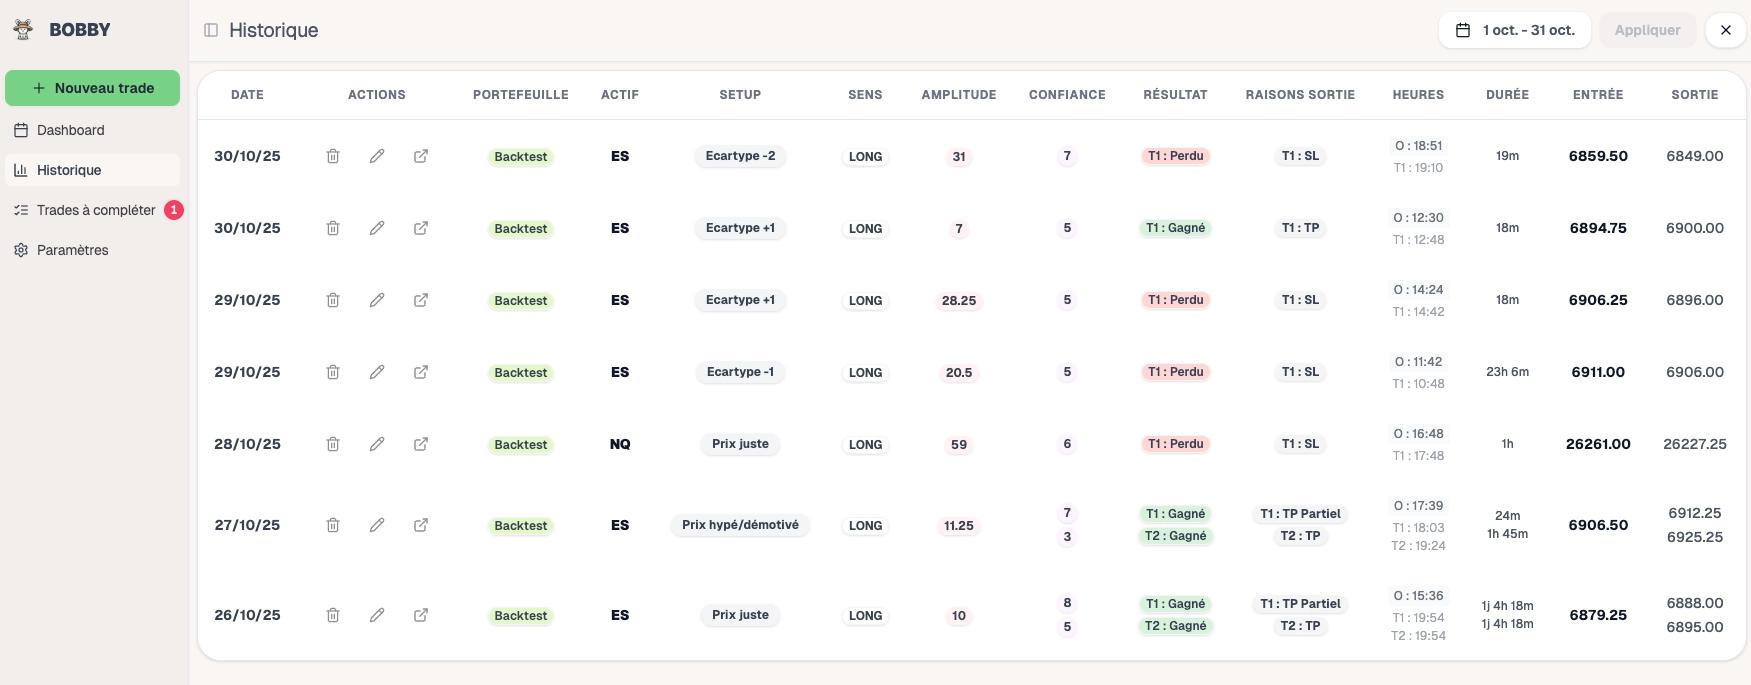
Stage 1:
- The account: backtesting or live conditions?
- The asset, such as MES or NQ
- Direction: long or short
- Entry date and time
- Entry price
- Strategy or setup used, such as VWAP or fair value
- Target take profit
- Planned stop loss
- Confidence in the take-profit target, on a scale of 1 to 10
- Market range, which matters for my trading method
Stage 2:
- Exit price
- Reason for exiting
- Exit date and time
- Drawdown in points if I closed in profit
Stage 3:
- Whether I moved the stop to break even
- Whether I regretted moving it to break even
- Profit left on the table: how many points price travelled after I exited
Profit left on the table is subjective. You aren't recording the furthest price eventually moved, but how far you could realistically have held the trade.
For example, if price falls all day for a total of 300 points, that doesn't mean you'd have held for all 300.
The actual missed opportunity is much smaller.
My approach: standardise execution, not risk
I record every trade as though I'd used just one contract or lot, regardless of the actual position size.
If I trade the S&P 500 with three lots and make €1,000, I record it as though I'd taken only one lot.
PnL is therefore divided by three.
At this stage, risk management isn't what I'm evaluating. I want to know whether the way I trade is good.
The journal helps me assess my timing, market reading and execution quality.
The work on risk comes later, based on statistical analysis.
How do you analyse a trading journal?
Track performance indicators
Using the data collected for each trade, you can calculate ratios and basic statistics such as:
- PnL: the profit or loss over a given period
- Win rate: winning trades as a percentage of all trades
- Planned risk-reward ratio: what you're willing to risk relative to your expected gain
These indicators are useful, but they aren't enough.
More precise indicators can help assess trading quality and identify concrete improvements:
- Expectancy: how much a trade earns on average
- Sharpe ratio: measures the stability of trading performance
- Profit factor: how much you make for each €1 lost
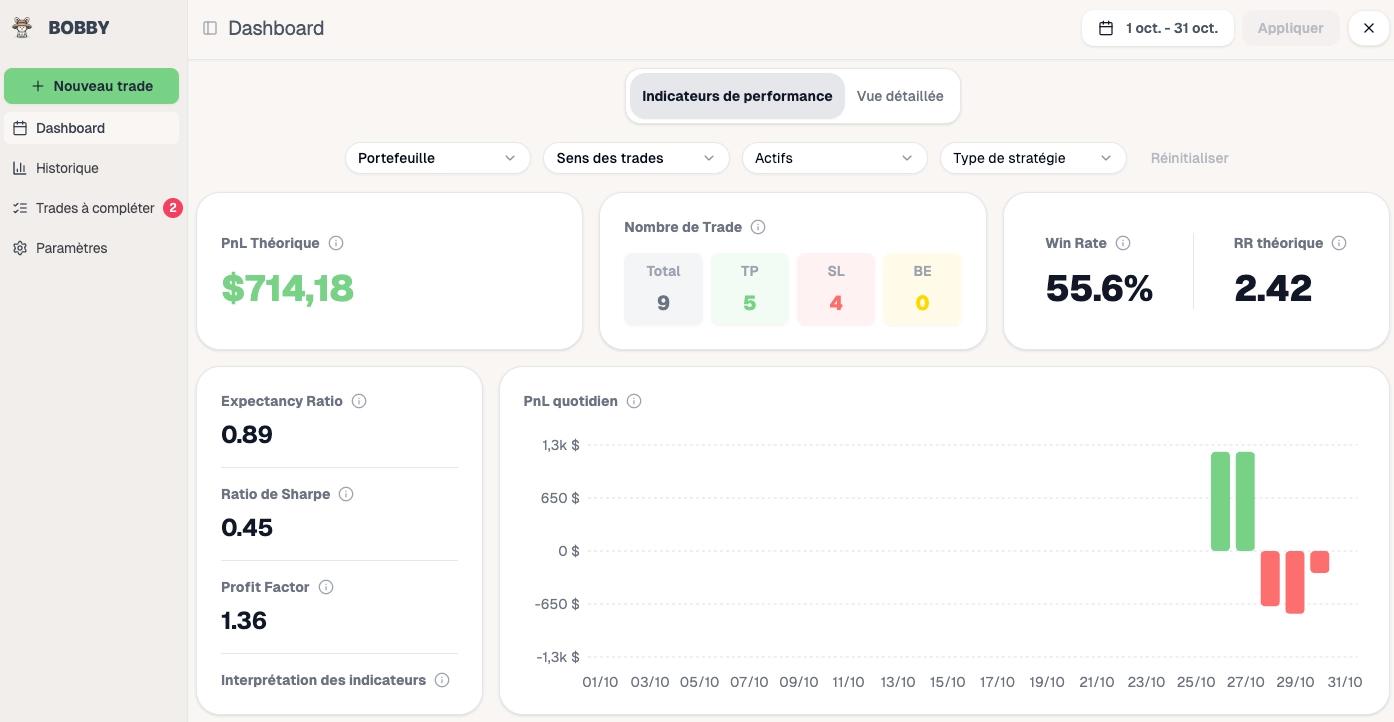
Interpret performance indicators together
To interpret these indicators properly, you need to analyse them together.
Expectancy alone isn't enough to assess trading quality.
You can finish the month with positive expectancy, but if one big trade makes up for weeks of losses, profitability rests on a few lucky wins.
That's where the Sharpe ratio comes in.
It measures performance stability by addressing a simple question: are profits consistent or concentrated in a few trades?
Combining expectancy and the Sharpe ratio gives you a good idea of your trading quality.
First example: expectancy of 0.3, profit factor of 1.6, but a Sharpe ratio between 0 and 1.
The trading is profitable, but those profits may be lucky wins because they aren't consistent.
Second example: expectancy of 0.15, a profit factor of 1 to 1, but a Sharpe ratio of 1.5.
That's typically someone taking lots of small, consistent profits with a good win rate.
If the win rate is 70% or 80%, that suggests they've found an approach that suits them and perform well in that context.
Filter advanced statistics
Once you understand the basic indicators, refine your analysis by filtering statistics by:
- Asset
- Strategy
- Trading session
- Direction: long or short
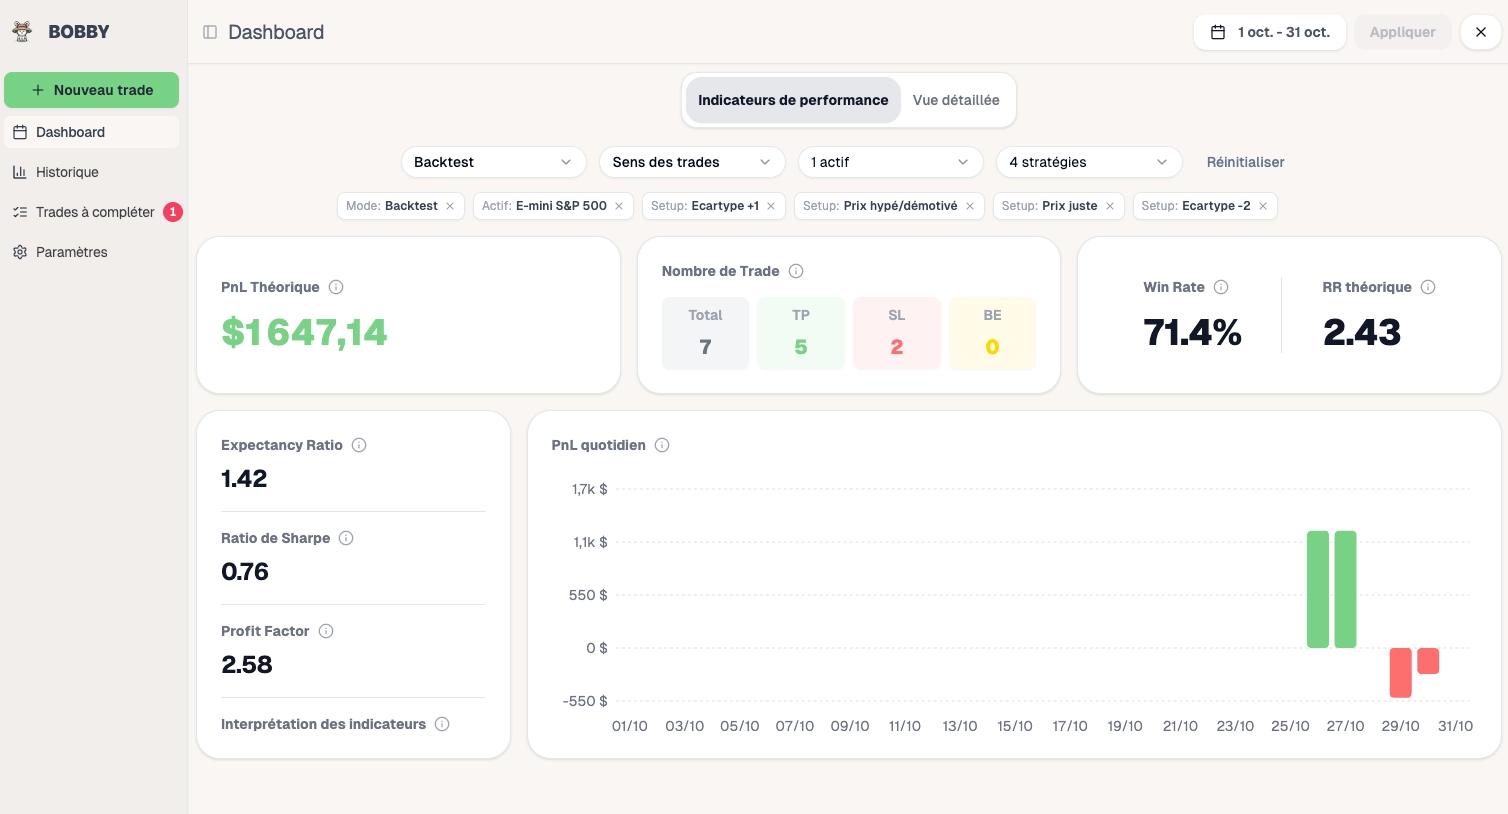
These filters reveal what really works in your trading.
For example, isolate a specific strategy, such as Fair Value or Standard Deviation, to examine its expectancy and Sharpe ratio.
You can also compare performance by asset or session:
- Do you perform better during the US or European session?
- Which asset generates the most profit?
Filtered analysis also helps measure profit left on the table by strategy and identify where to improve.
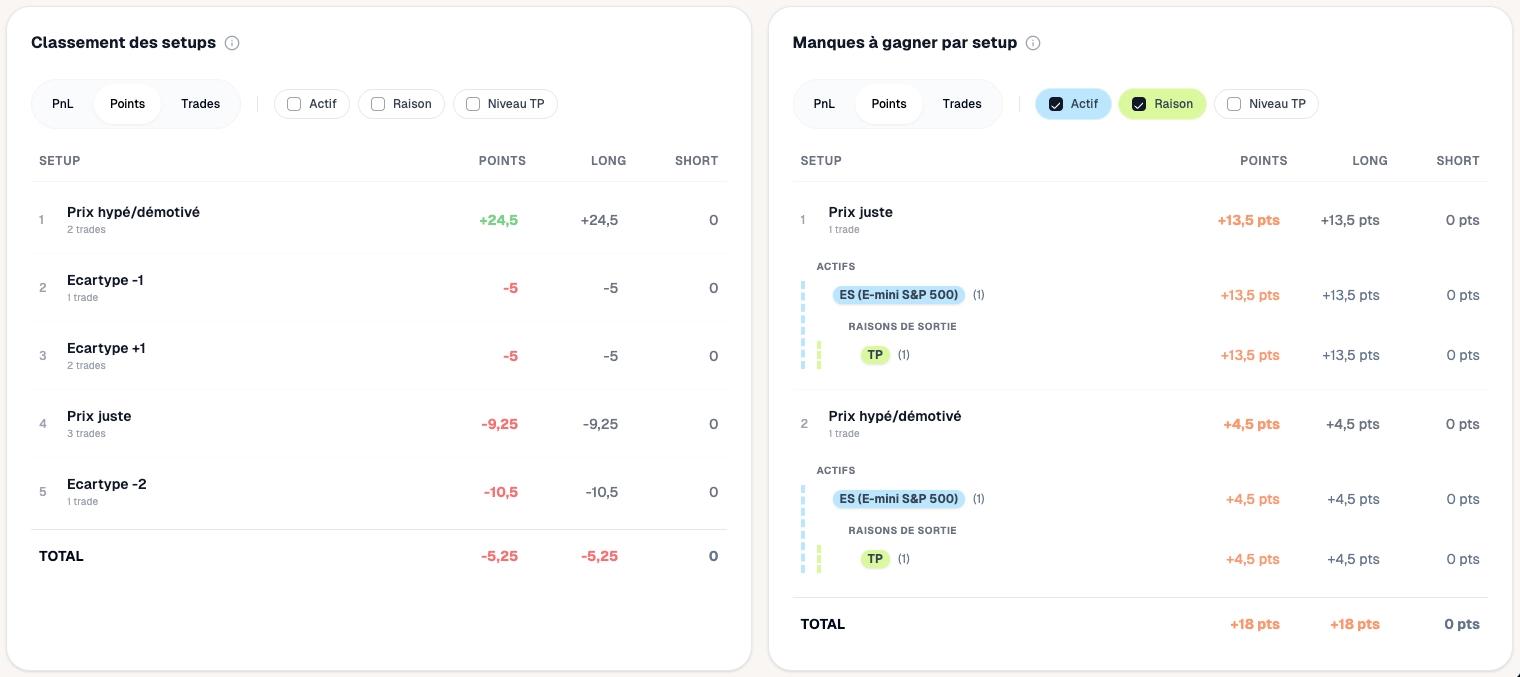
Turn analysis into concrete action
Statistical analysis identifies what works and what doesn't.
You can then start adapting your trading plan: remove losing strategies, build on profitable ones, adjust which assets you trade or which sessions you prioritise.
Once you've made those adjustments, the next step is checking whether you can reproduce the new results in a live account.
You can get excellent demo or backtest results but fail to replicate them live because of psychology.
Examples of concrete adjustments:
- If the data shows you consistently lose on support breaks, remove them from your strategy
- If returns to equilibrium during the US session are very profitable, use that strategy more
- If sudden moves often stop you out, tighten the stop loss or wait for stronger confirmation before entering
- If you leave a lot of points on the table with a particular strategy, or after moving to break even too quickly, you may be able to be less defensive and aim for more ambitious targets
When should you analyse your journal?
You first need enough data for your analysis to be meaningful and unbiased.
I recommend at least a hundred trades before drawing conclusions.
Once you've reached that threshold, review frequency depends on your trading style.
You can review your journal weekly, monthly or quarterly.
The important thing is to be consistent so you can spot trends and gradually adjust your strategy.
