
What is Fibonacci?
In trading, Fibonacci retracement is a tool based on the mathematical Fibonacci sequence.
Let's start with a little history:
Fibonacci was an Italian mathematician born more than 800 years ago.
In 1202, he published work on a number sequence known as the Fibonacci sequence.
Each number is the sum of the two before it.
For example:
0, 1, 1, 2, 3, 5, 8, 13, 21, 34...
Dividing a number in the sequence by the next gives approximately 0.618.
For example:
21/34 ≈ 0.618
This number is called the "golden ratio".
Why use Fibonacci in trading?
The golden ratio, 0.618, appears everywhere: nature, art, architecture...
For example, the relationship between the length of your finger bones and the size of your hand follows this ratio.
Even the Mona Lisa's face follows these proportions.
What does that have to do with trading? Some traders believe this universal ratio can also apply to financial markets.
The golden ratio, 0.618, is the basis of Fibonacci retracement in trading.
The idea is that after a strong upward or downward trend, price tends to retrace 61.8% before continuing in its original direction.
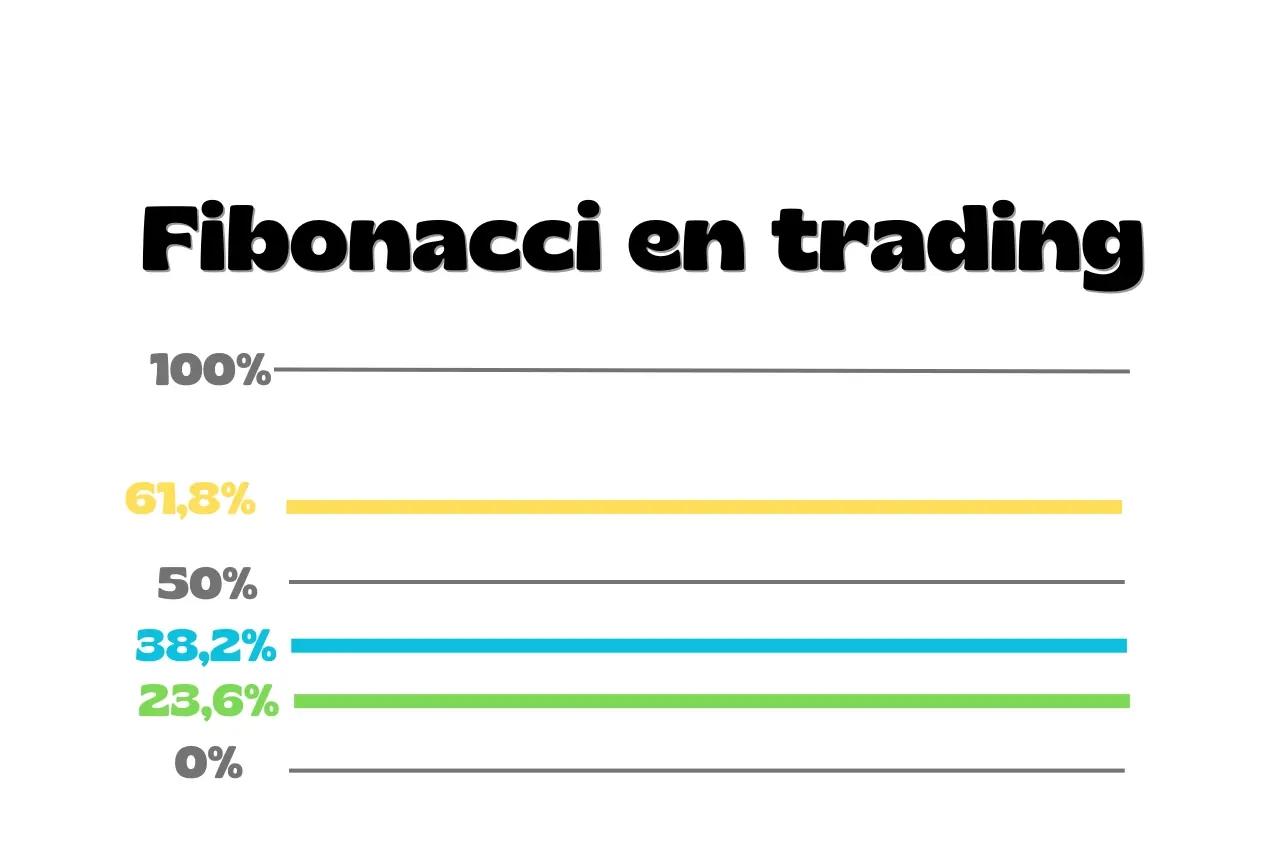
Fibonacci levels in trading
Three Fibonacci retracement levels are mainly used:
- 23.6%
- 38.2%
- 61.8%, the famous golden ratio
To derive these levels:
- 61.8%: divide a number in the sequence by the next one
- 38.2%: divide it by the number two places ahead
- 23.6%: divide it by the number three places ahead
The 50% level is often added. It isn't directly related to the Fibonacci sequence, but it has psychological importance for many traders.
How do you use Fibonacci retracement?
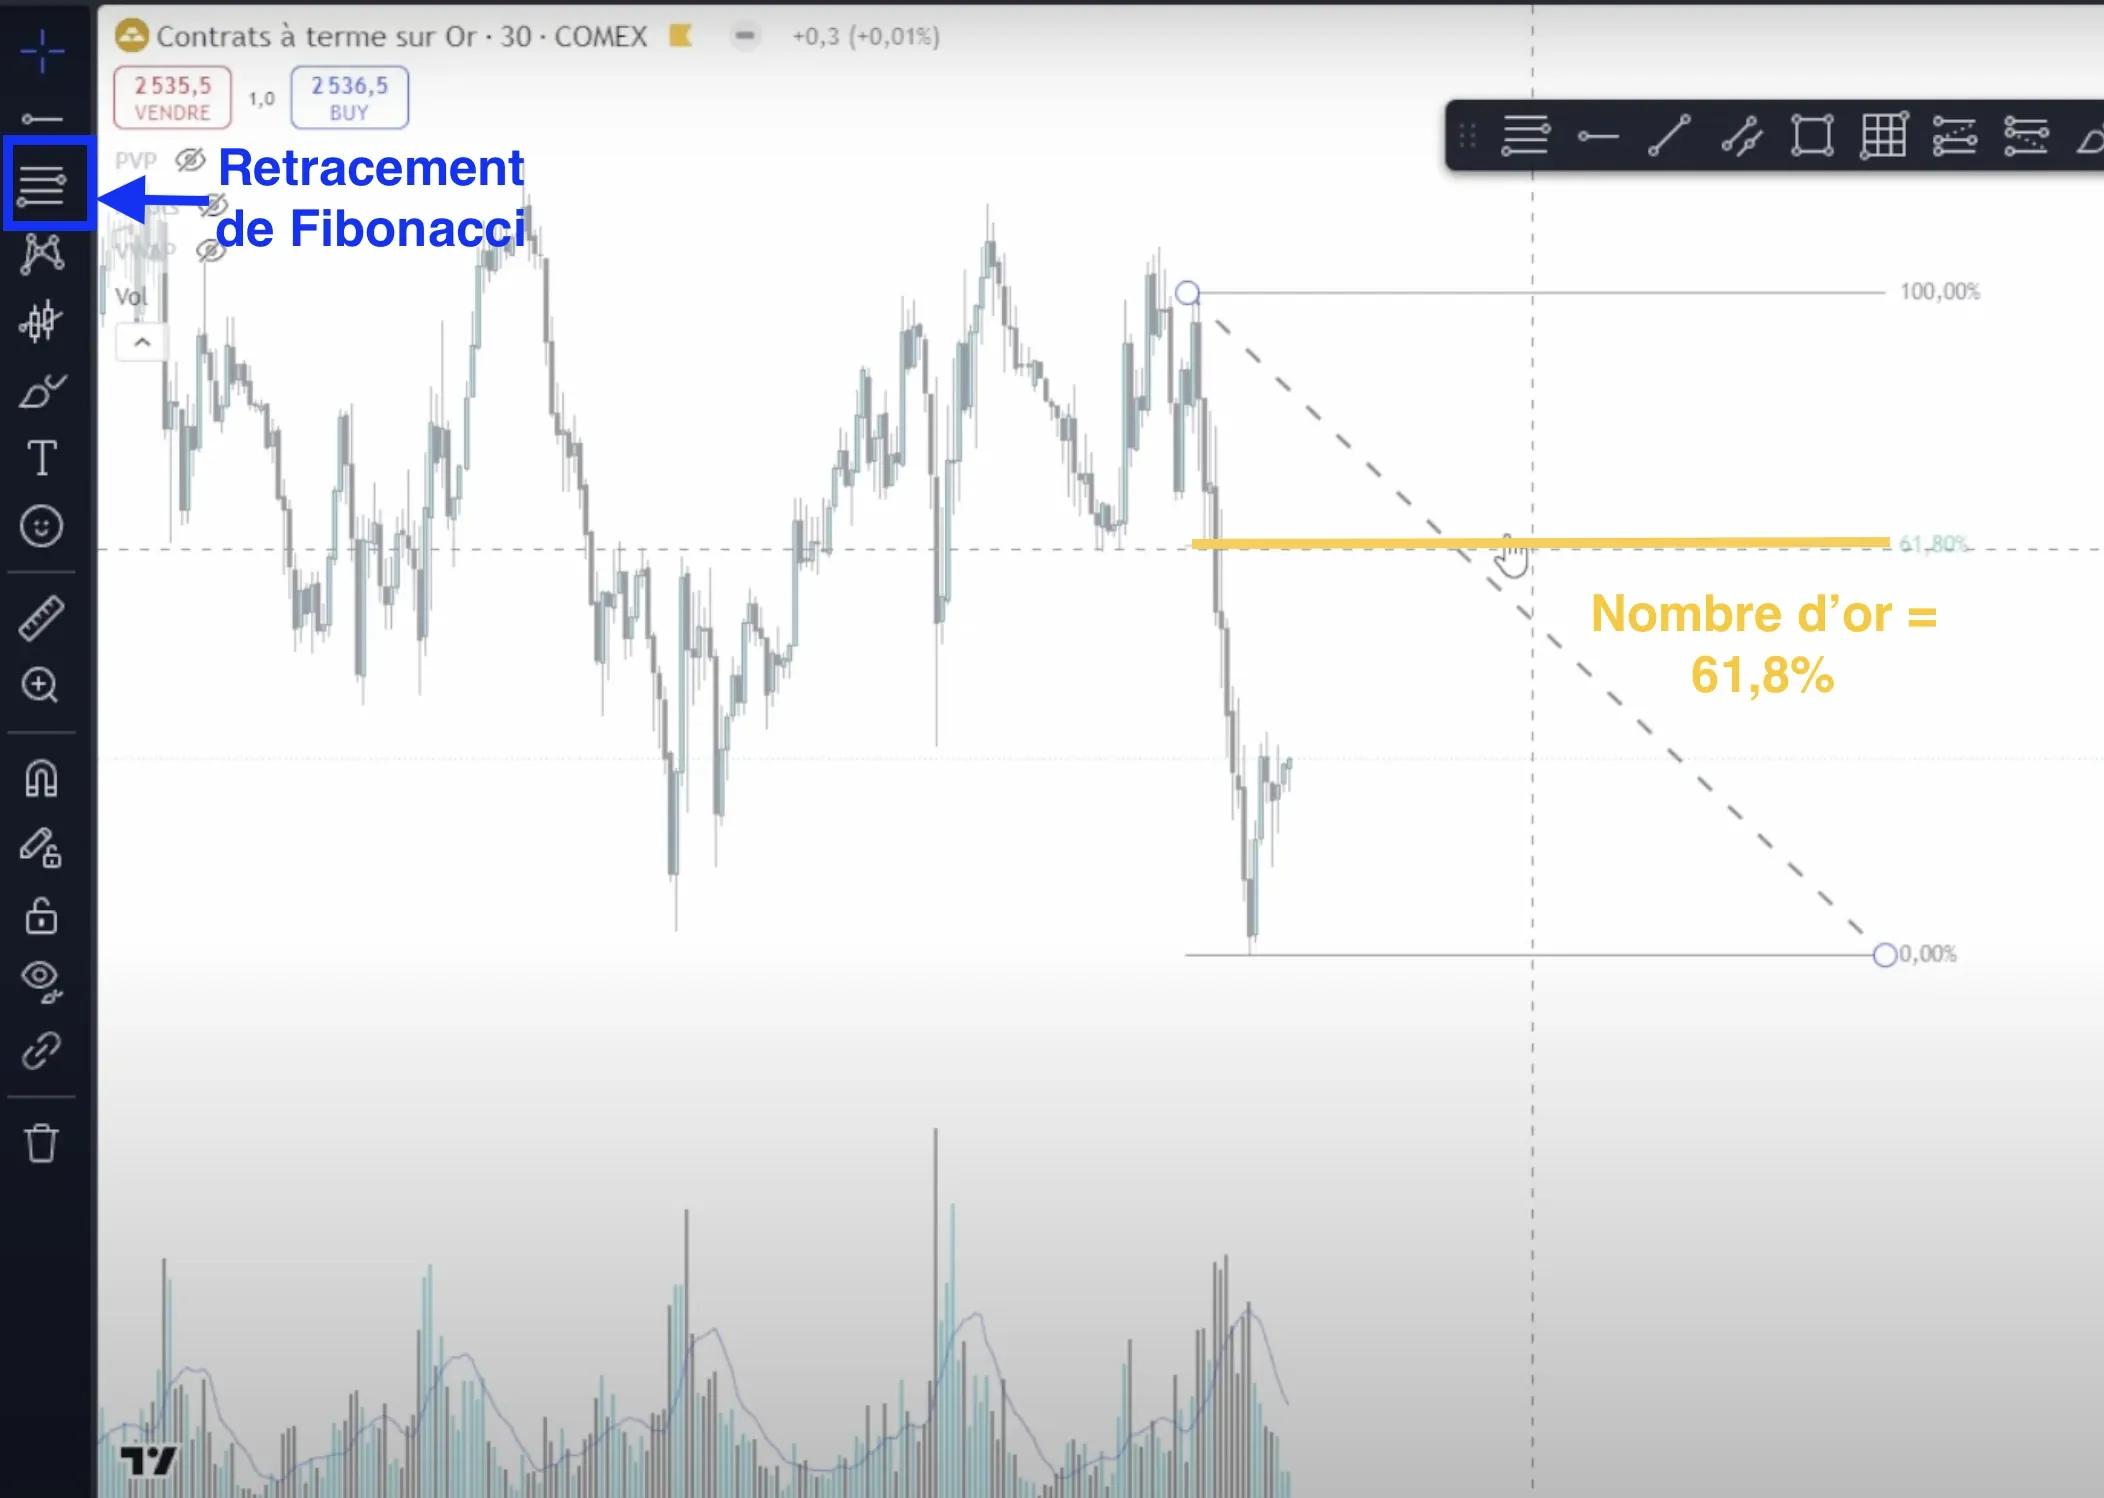
On a chart:
- Identify a clear trend, an upward or downward move
- Draw the Fibonacci retracement from the low to the high, or the other way around
- Watch the key levels: 23.6%, 38.2%, 50% and 61.8%
These levels can act as potential support or resistance.
Many traders use them to:
- Look for entries in the trend's direction, shown in green on the chart
- Place stop losses
- Set take-profit targets
Different ways to use Fibonacci in trading
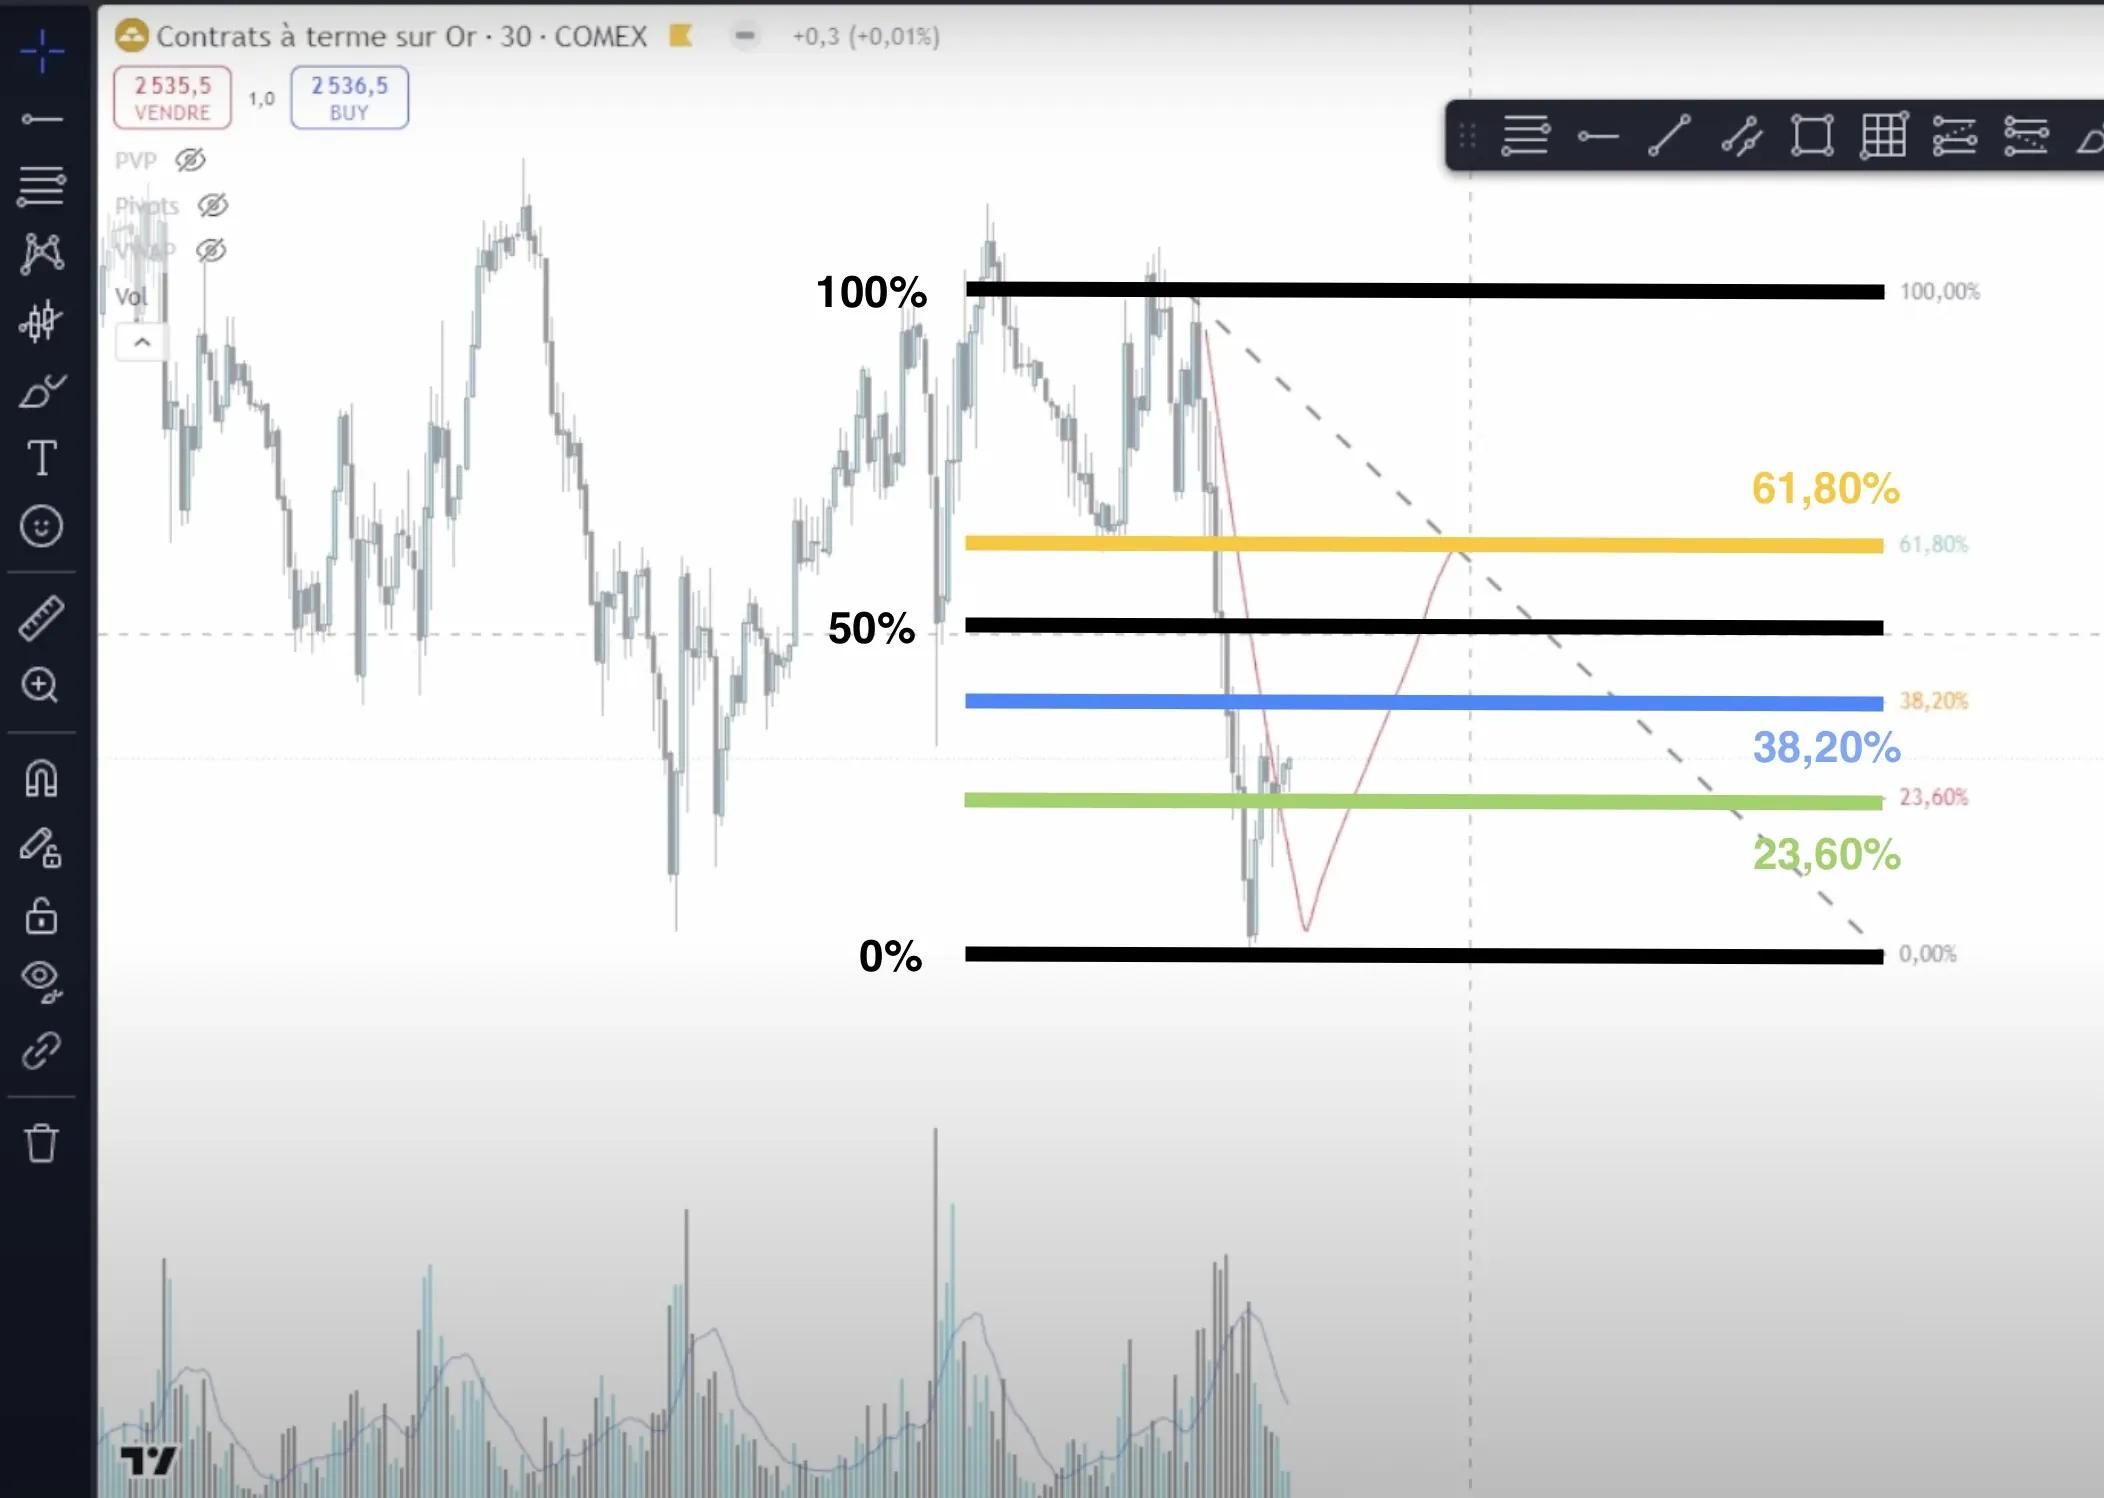
1. A natural retracement to 61.8%
Some trading theories, such as Smart Money Concepts (SMC), consider a retracement to 61.8% "natural".
If price reaches that level after a strong trend, it could be a good entry point in the direction of the original trend.
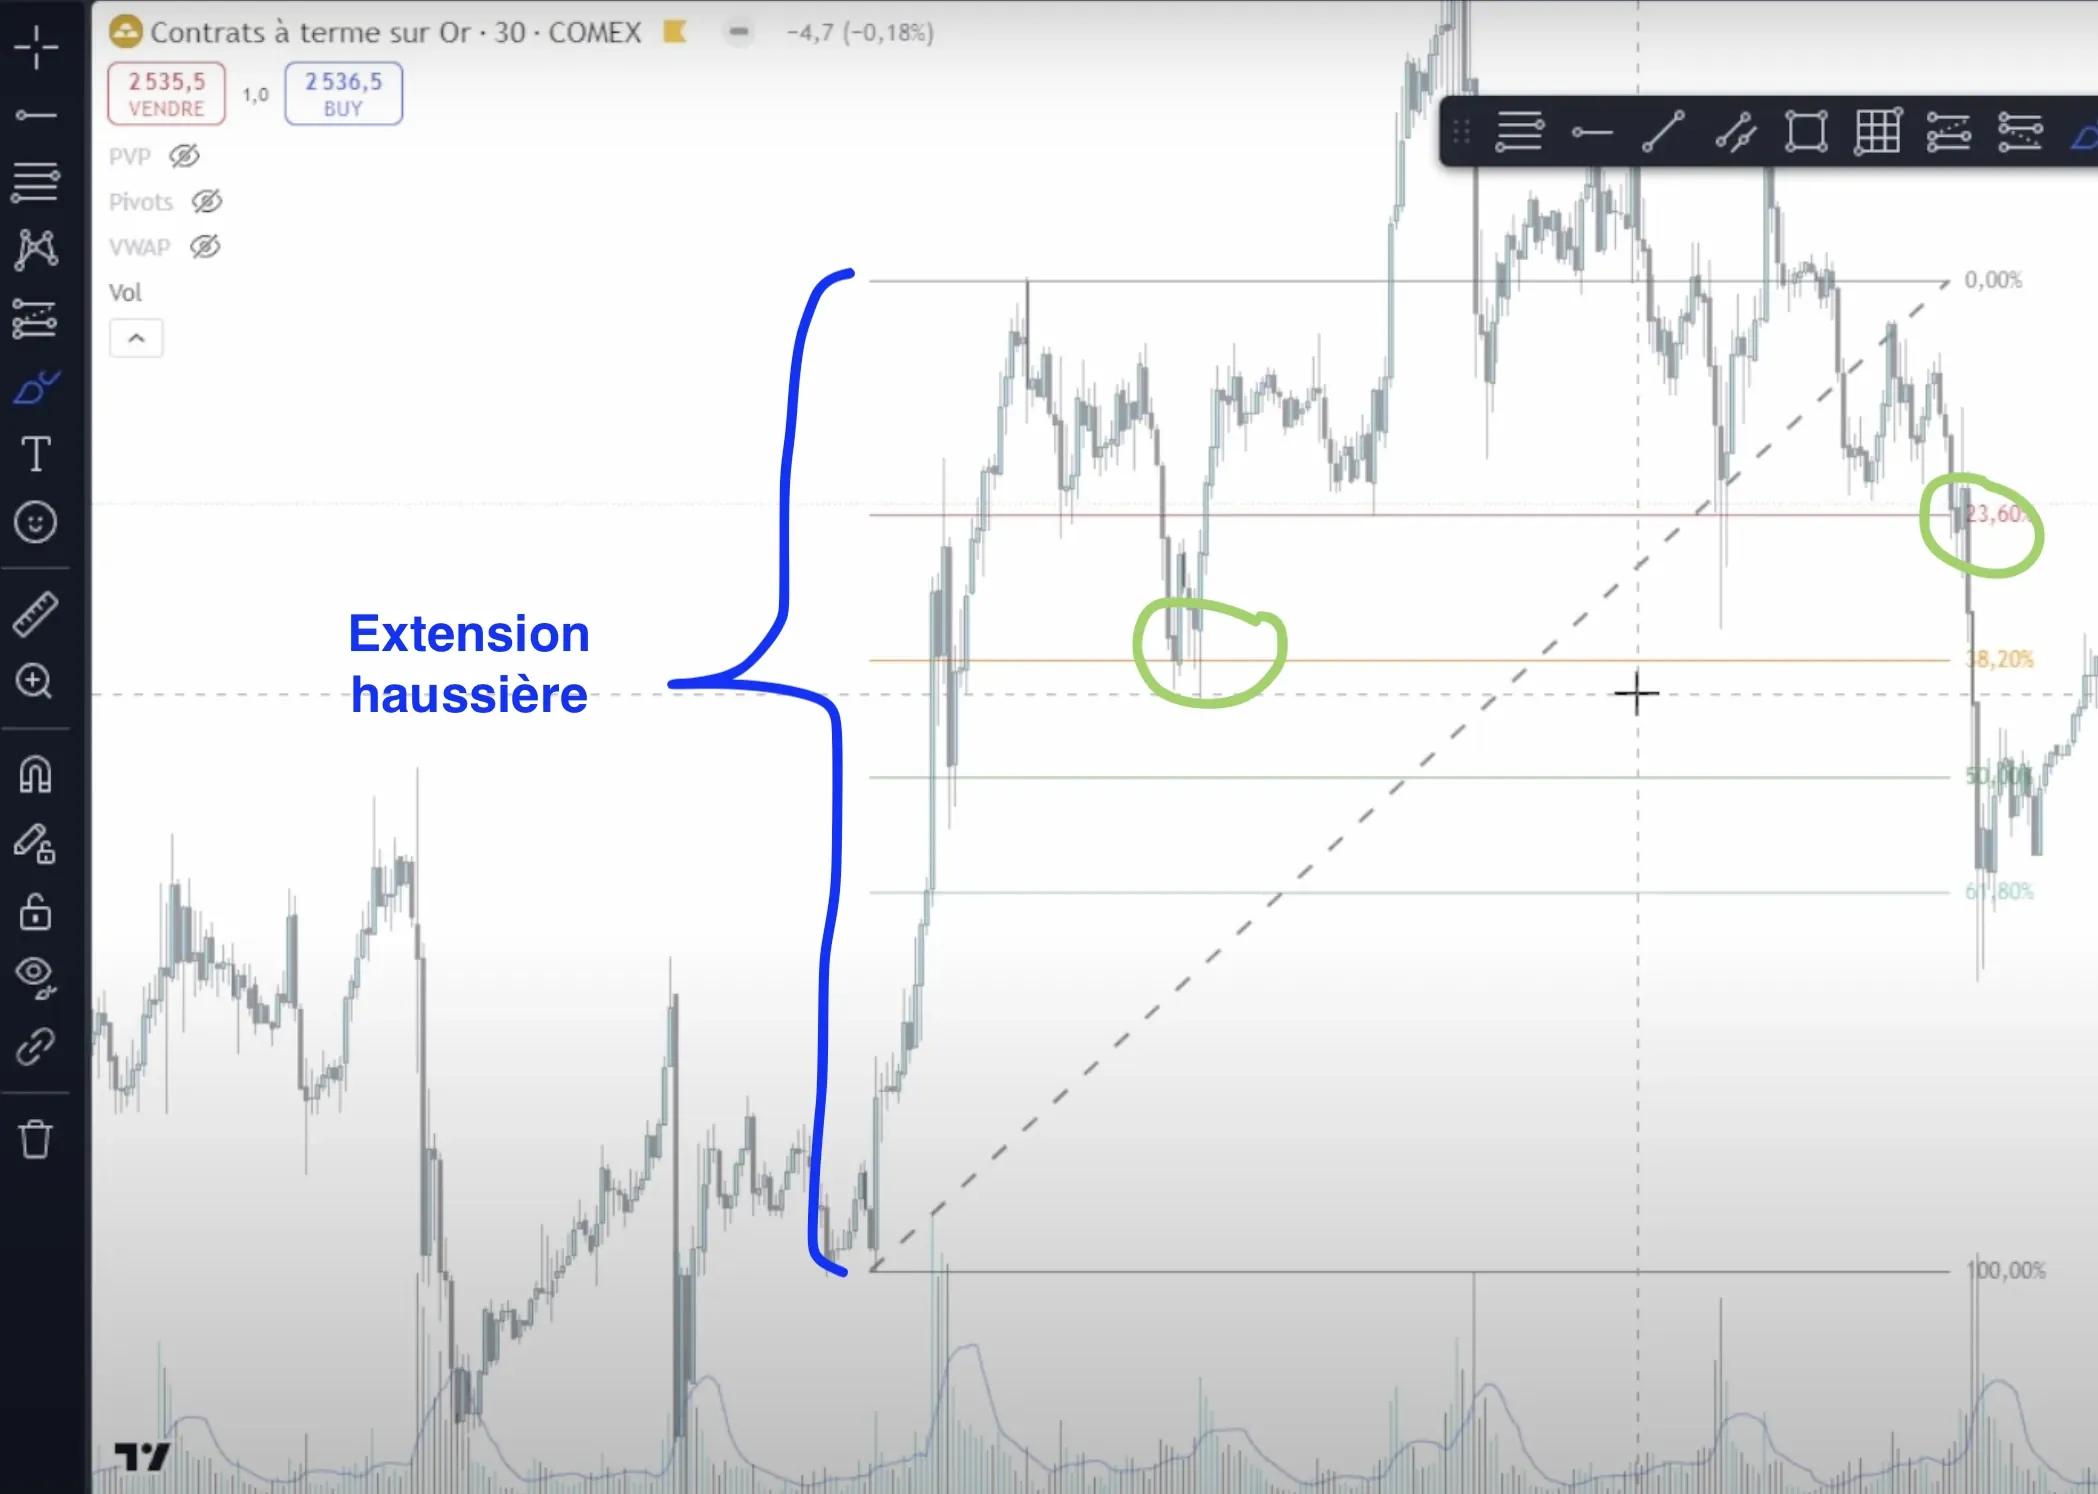
2. Reactions at shallower levels
Sometimes the move is so strong that price doesn't retrace all the way to 61.8%.
In that case, watch how it reacts at the shallower levels:
- 38.2%: a bounce here may indicate a strong underlying trend
- 23.6%: a reaction here may signal a very powerful trend
3. The psychological 50% level
The 50% level is often seen as a point of balance between buyers and sellers.
It isn't strictly a Fibonacci level, but many traders use it.
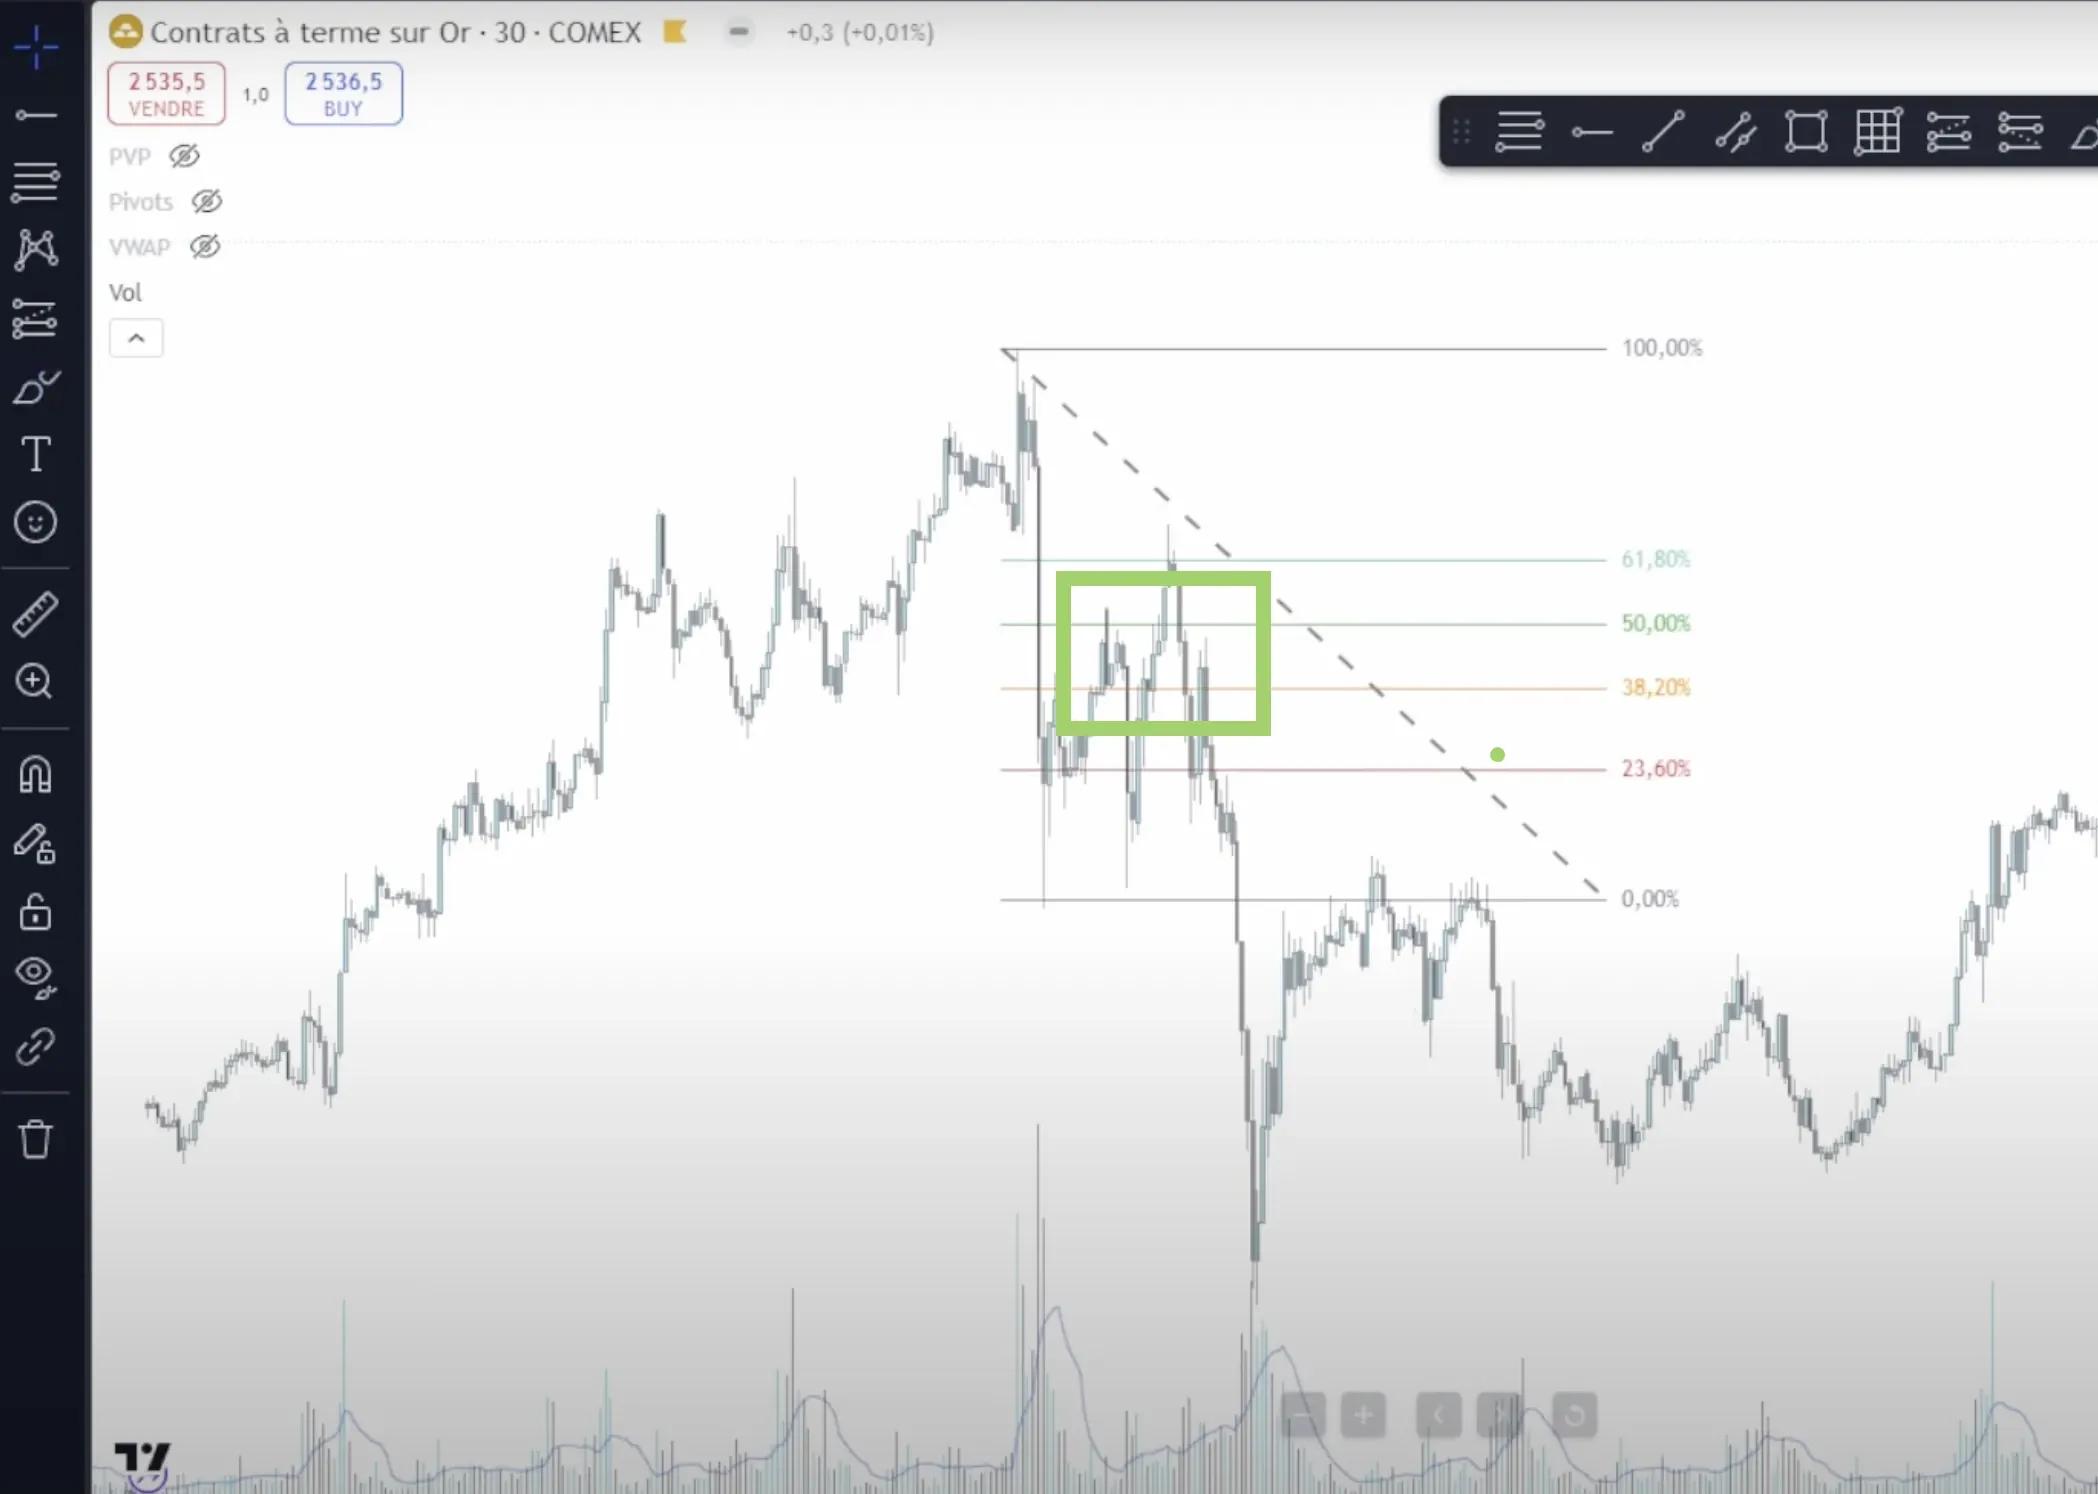
I've marked an area in green on the chart above. That's where you can see the 50% level in action:
- Price falls sharply
- It recovers and stops at the 50% level
- It hesitates there
- It then rises to 61.8% before falling again
What can we take from that?
- This is an area where price hesitates
- It may offer a selling opportunity if you think the decline will continue
- For buyers, it's a level to watch. If price can't get beyond it, the downtrend may be confirmed
Even though the 50% level worked well here, it doesn't always.
The limits of Fibonacci retracement
Because so many traders use Fibonacci, their reactions at the same levels can influence price movements.
That often creates a self-fulfilling effect.
Fibonacci levels therefore offer no guarantee and don't work every time.
Never use Fibonacci as your only decision-making tool. Use it to complement a strategy, such as chart analysis.
You also need to know that drawing Fibonacci levels is subjective. Traders may choose different points for their retracements.
Two traders analysing the same chart can therefore get different results.
One final point: Fibonacci's effectiveness varies with market conditions.
It's more useful in trending markets. Without a clear direction, its usefulness is more limited.
